Khan Academy
Khan Academy: Make Bar Graphs 1
Practice creating bar graphs (bar charts) from data sets. Students receive immediate feedback and have the opportunity to try questions repeatedly, watch a video or receive hints.
Math Is Fun
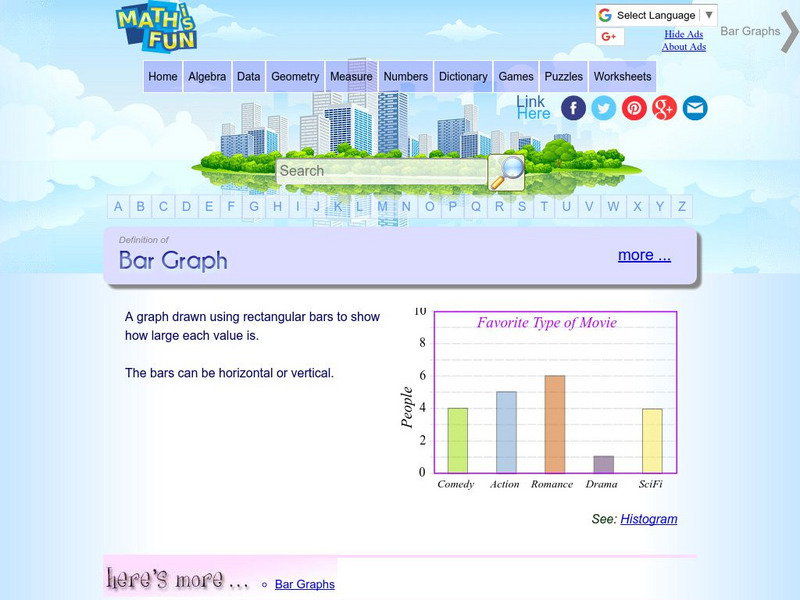
Math Is Fun: Definition of Bar Graph
Get the definition for a bar graph. Then, select the link "here's more" and use the interactive graph to display data as a bar graph, line graph or pie chart. The finished graph may be printed.
PBS
Pbs Learning Media: Math + Arts: Stage Props, Blocking, and Graphs
In this instructional activity, students will block a scene on a graph and act out the scene. Media resources and teacher materials are included.
PBS
Pbs Learning Media: Math + Art: Graph a Dance
In this lesson plan, students will choreograph a figure for a square dance, graph it, and perform it. Media resources and teacher materials are included.
Primary Resources
Primary Resources: Line Graphs and Pie Charts
Here are a few resources to use with your students when teaching about line graphs or pie charts.
Concord Consortium
Concord Consortium: Stem Resources: Building a Zip Line
For this interactive, students plan, create, and test a zip line that will transport a hard-boiled egg without breaking it. They will make improvements on their design based on data about its performance. A motion sensor is required in...
PBS
Pbs Learning Media: A Flooding Threat
In this video segment from Cyberchase, the CyberSquad uses a graph to estimate how much the water level will rise in the Sensible Flats reservoir.
Khan Academy
Khan Academy: Make Line Plots
Practice creating line plots (dot plots) from data sets. Students receive immediate feedback and have the opportunity to try questions repeatedly, watch a tutorial video, or receive hints.
Khan Academy
Khan Academy: Read Line Plots (Data With Fractions)
Practice reading and interpreting data that is graphed on line plots. The data graphed includes fractions. Students receive immediate feedback and have the opportunity to try questions repeatedly, watch a video or receive hints....
Shodor Education Foundation
Shodor Interactivate: Lesson: Lines, Rays, Line Segments, & Planes
This robust lesson plan for upper elementary and middle school grades introduces the concepts for lines, rays, line segments, and planes. Resources are linked to it and ready for your use.
National Center for Ecological Analysis and Synthesis, University of California Santa Barbara
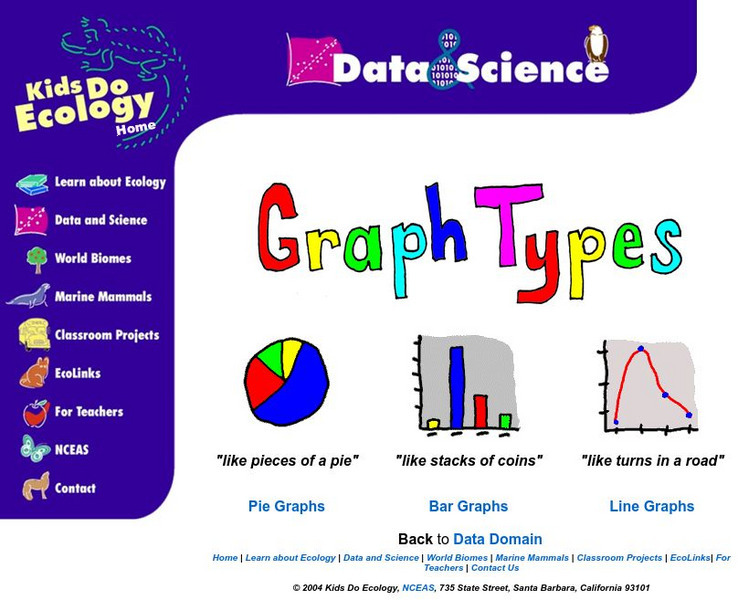
Nceas: Graph Types
At this site from NCEAS you can learn how to organize your data into pie graphs, bar graphs, and line graphs. Explanations and examples are given of each graph along with several questions that check comprehension.
University of Cambridge
University of Cambridge: Nrich: Graphing Number Patterns
On this one page website sharpen your logic, graphing and pattern recognition skills while working on this challenge. The solution is available to double check your solution.
Math Is Fun
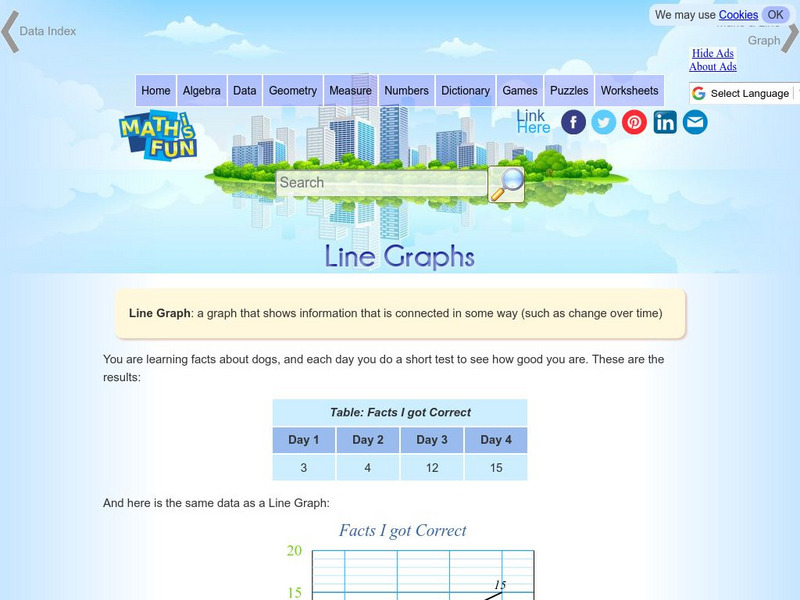
Math Is Fun: Line Graphs
Explains, with examples, what a line graph is and how to construct one. Includes a set of practice questions.
BBC
Bbc: Representing Data
This BBC Math Bite tutorial for line graphs, pictograms, and frequency polygons features an exam in which students draw and interpret statistical diagrams.
Khan Academy
Khan Academy: Equivalent Fractions on the Number Line
Graph and identify equivalent fractions on a number line. Students receive immediate feedback and have the opportunity to try questions repeatedly, watch a video or receive hints. CCSS.Math.Content.3.NF.A.3.a Understand two fractions as...
Khan Academy
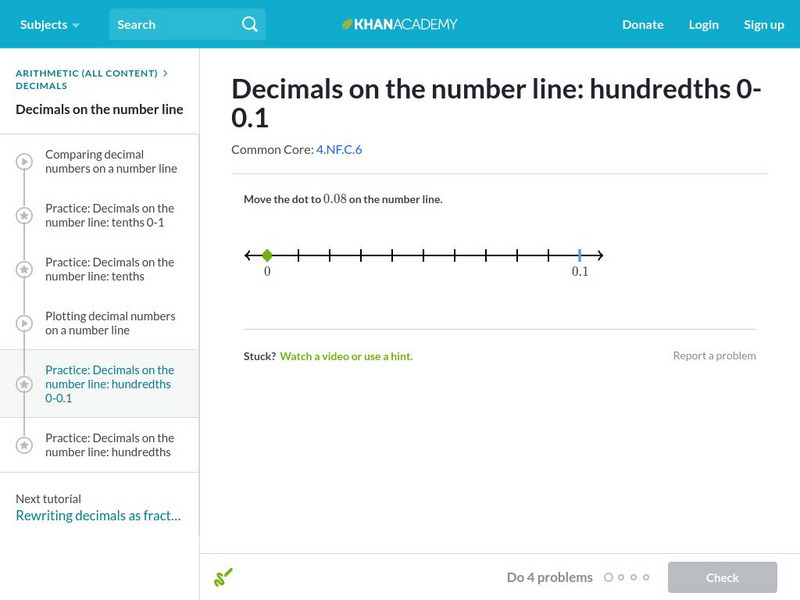
Khan Academy: Decimals on the Number Line: Hundredths 0 0.1
Graph hundredths between 0 and 0.1 on a number line. Students receive immediate feedback and have the opportunity to try questions repeatedly, watch a video or receive hints.
Khan Academy
Khan Academy: Decimals on the Number Line: Tenths 0 1
Graph tenths between 0 and 1 on the number line. Students receive immediate feedback and have the opportunity to try questions repeatedly, watch a video or receive hints.
Khan Academy
Khan Academy: Graph Data on Line Plots
Record measurements on line plots (also called dot plots). Students receive immediate feedback and have the opportunity to try questions repeatedly, watch a video or receive hints.
Khan Academy
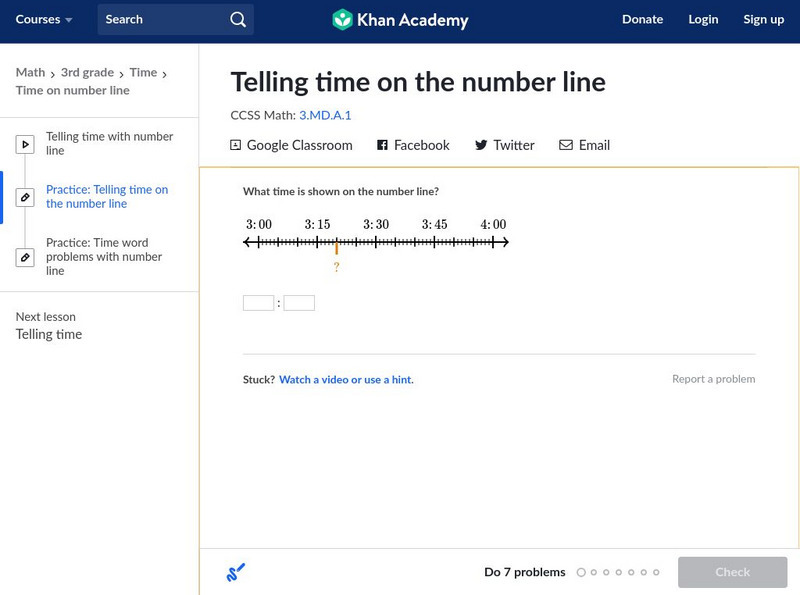
Khan Academy: Telling Time on the Number Line
Match time of a number line to time on an analog or digital clock. Graph a given time on a number line. Students receive immediate feedback and have the opportunity to try questions repeatedly, watch a video or receive hints.
Alabama Learning Exchange
Alex: "Ridin' Along in My Automobile"
Learners will research prices of used cars to discover how automobiles lose their value over time. Students will create a chart to record their information, use their chart to graph their data, and find measures of central tendency of...
The Math League
The Math League: Using Data and Statistics: Pie Charts
This introductory tutorial about statistical graphing with four examples of how pie charts (circle graphs) are constructed and read.
ClassFlow
Class Flow: Graphs
[Free Registration/Login Required] This flipchart presents bar and double bar graphs, line and double line graphs, pictographs, histograms, and circle graphs with review activities and web links for practice.
That Quiz
That Quiz
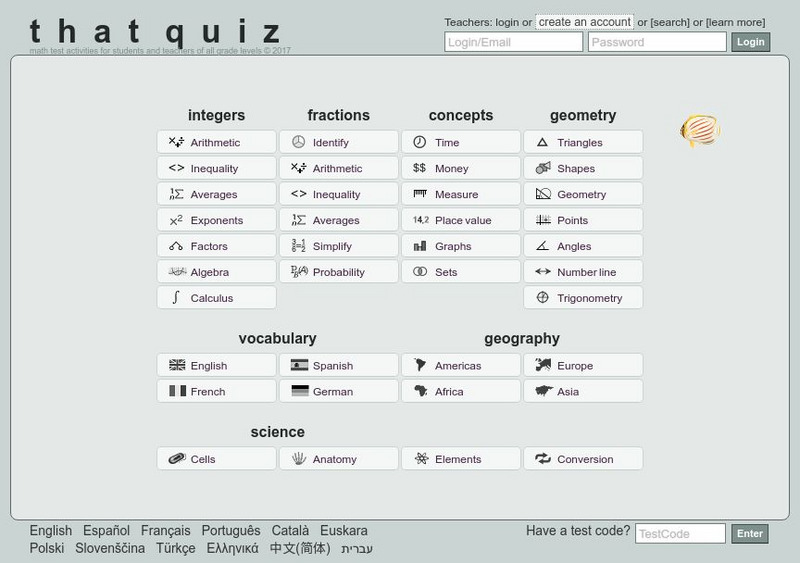
ThatQuiz is an excellent assessment tool for teachers and students. At this site, teachers can create individualized or group assessments on a variety of math topics. Students take these practice assessments directly online and receive...
Can Teach
Can Teach Lesson Plan: Graphing Constellations
In this lesson plan, students practice their graphing skills by following directions to recreate constellations.
Other popular searches
- Line Graphs
- Double Line Graphs
- Bar and Line Graphs
- Line Pie Bar Graph
- Interpreting Line Graphs
- Line Plot Graphs
- Making Line Graphs
- Reading Line Graphs
- Analyzing Line Graphs
- Creating Line Graphs
- Number Line Graphs
- Reading Double Line Graphs

