Hi, what do you want to do?
Fun Brain
Fun Brain: What's the Point? (Graphing Skills Game)
This graphing game challenges players to supply the coordinates for points shown on a series of graphs and also to plot pairs of coordinates on simple Cartesian planes.
PBS
Pbs Learning Media: Decreasing Water Levels
The CyberSquad creates a line graph to help tell the story of the decreasing water levels in Sensible Flats in this video segment from Cyberchase.
The Math League
The Math League: Using Data and Statistics
This site contains two short examples of line graphs, charts that show change over time. This is a quick introduction to the topic of statistical graphing.
Houghton Mifflin Harcourt
Houghton Mifflin Harcourt: Saxon Activity Center: Real World Investigation: Elevation Changes [Pdf]
Math and geography are the focus of this internet investigation. Learners must plan a road trip to several cities and plot the elevations of those cities using a line graph. Acrobat Reader required.
PBS
Pbs Mathline: Button, Button Lesson Plan [Pdf]
An integrated math and language arts lesson focusing on statistics. Students explore the concepts of estimation, data collection, data analysis, classification, graphing, and counting through the reading of the Button Box by Margarette...
Beacon Learning Center
Beacon Learning Center: All That Data
Students analyze data by finding the mean, median, mode, and range of a set of numbers. Line plots, bar graphs, and circle graphs are also included in this lesson.
PBS
Pbs: Mathline Creature Feature Lesson Plan [Pdf]
An interdisciplinary math, science, and language arts lesson that engages students in an exploration of statistics. Through a study of various forest climates, students utilize data collection and analysis, classification, and graphing....
Ducksters
Ducksters: Kids Math: Graphs and Lines Glossary and Terms
This site contains a math glossary and terms on graphs and lines for kids. Find definitions used in this mathematics subject such as coordinates, midpoint, and slope.
The Math League
The Math League: Ratio and Proportion
This tutorial provides definitions and examples of ratios and proportions and features comparing ratios and converting rates.
PBS
Pbs Mathline: Sand Babies (Pdf) [Pdf]
In this engaging lesson, learners use a variety of measurement strategies in creating their own Sand Babies. Students explore standard and non-standard measurements, area, data collection and analysis, and graphing. Adaptations are...
PBS
Pbs Learning Media: Keeping Track of the New York City Marathoners
In this video segment from Cyberchase, Bianca figures out a way to count the thousands of runners in the New York City Marathon.
Alabama Learning Exchange
Alex: Heart Line Express
During this lesson, students will plan and execute a week-long school-wide valentine sales business. From the Grand Plan to job applications, interviews, valentine production, advertising, sales and profits students are immersed in the...
Shodor Education Foundation
Shodor Interactivate: Lesson: Arithmetic Practice W/ Ordered Pairs
The Shodor Education Foundation provides this lesson plan to have students practice simple computation that results in them graphing their answers. If they are accurate they will have a straight line. Students use an interactive...
Better Lesson
Better Lesson: Jumping Into Math, Measurement, & Data Day 1
Third graders apply measurement, graphing, and data skills to the real world context of physical education with standing jumps.
National Council of Teachers of Mathematics
Nctm: Illuminations: Bar Grapher
A computer applet that will draw any bar graph with student's data input.
Math Is Fun
Math Is Fun: Make an Alien Mask Using Ordered Pairs
This website gives you the ordered pairs you need to make an Alien mask using graph paper.
Math Is Fun
Math Is Fun: Make a Dinosaur Using Ordered Pairs
This website gives you the ordered pairs you need to make a Diplodocus dinosaur using graph paper.
Math Is Fun
Math Is Fun: Make a T Rex Dinosaur Using Ordered Pairs
This math tutorial on ordered pairs has students make a T-Rex dinosaur using graph paper.
Annenberg Foundation
Annenberg Learner: Making a Stem and Leaf Plot
A line plot may not be a useful graph for investigating variation so we must come up with a new representation based on groups of data. Construct a stem and leaf plot from a set of 26 data values.
Curated OER
Physics4 kids.com: Electricity & Magnetism: Resistance
Simple line graph showing the inverse relationship between the amount of electrical resistance and the amount of work possible.
Louisiana Department of Education
Louisiana Doe: Louisiana Believes: Eureka Math Parent Guide: Collecting and Displaying Data
A guide to support parents as they work with their students in collecting and displaying data.
University of Cambridge
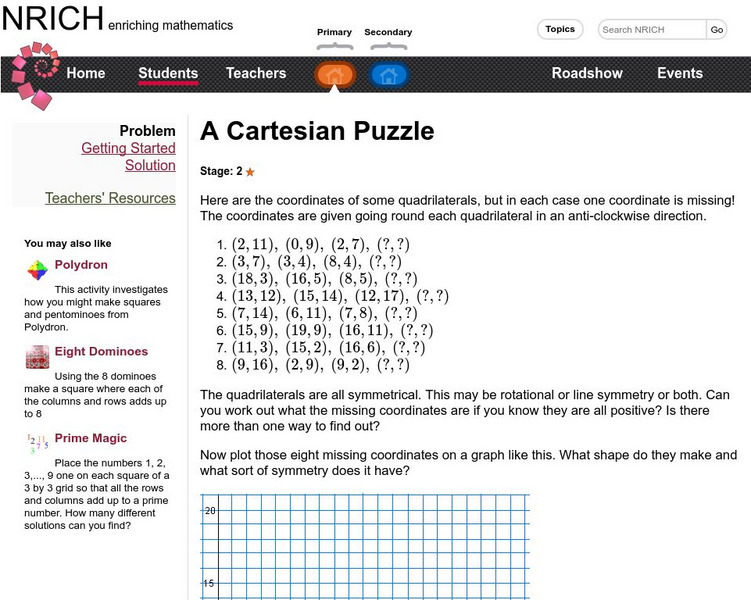
University of Cambridge: Nrich: A Cartesian Puzzle
This one page website lets you practice plotting points on the coordinate grid. See if you can find the missing coordinates to complete the shapes. When you are finished the solutions are only a click away.
Other popular searches
- Line Graphs
- Double Line Graphs
- Bar and Line Graphs
- Line Pie Bar Graph
- Interpreting Line Graphs
- Line Plot Graphs
- Making Line Graphs
- Reading Line Graphs
- Analyzing Line Graphs
- Creating Line Graphs
- Number Line Graphs
- Reading Double Line Graphs


