Hi, what do you want to do?
Curated OER
Count On It!
Learners practice counting money. In this consumer math lesson, students identify the various U.S. coins and group them in various ways to equal a dollar. Learners will use the money they collected for a donation towards a non-profit...
Curated OER
Weather Report Chart
Students complete a weather report chart after studying weather patterns for a period of time. For this weather report lesson, students measure temperature, precipitation, cloud cover, wind speed, and wind direction for a month. Students...
Curated OER
I'm a Weather Watcher Watching plants grow by......my,my,my
Learners investigate how weather affects how plants grow. They collect data on weather and plant growth for a week and display the data on a graph. For a culminating experience they design a movie using software that shows plant growth...
Curated OER
Potential Energy: How is It Related to Kinetic Energy?
Students explore kinetic and potential energy. In this energy lesson, students launch toys cars from ramps in order to examine the relationship between potential energy and kinetic energy. Students collect data and graph the results.
Curated OER
Saving Money Through Mathematics
Third graders discuss light sources and collect data about energy sources. They compare data and create a multiple line graph showing energy used by light sources for each student in the group. They present their graphs and write a...
Curated OER
Extraordinary Compilations
Students discuss and record why people have various types of collections. They interpret the class collection of information then use details about the Morgan Dollar to understand what collection characteristics it may have.
Curated OER
One Square Foot
Students identify, describe, count, tally, and graph life found in one square foot of land.
Curated OER
Measuring the Speed of a Wave
Students create an experiment in which they measure the speed of a wave and record the data in a graph. They work in small groups to write the procedure for the experiment and share it with another group for cross checking of the...
Curated OER
An Apple A Day
Students create a graph that showcases their pick for favorite kind of apple. Students are given samples of a variety of apples to determine their favorite in a taste test. They a create a tally chart of favorite kinds apples and use a...
Curated OER
The Cost of Life
Students research the salary for a career of interest. They consider what kind of lifestyle that career would provide and graph their information for comparison.
Curated OER
Predicting Temperature: An Internet/Excel Learning Experience
Third graders use the Internet (www.weather.com) to find the high temperature for our locale and the high temperature for another city around the world. They keep track of the temperature in these two locations for 10 days.
Curated OER
And the Winner Is...
Third graders participate in an election project. They collect data to create a spreadsheet from which a graph is generated.
Curated OER
What is a Cloud
Third graders study clouds and how they are formed. They write acrostic poems about clouds and analyze and graph temperature data collected during varying degrees of cloud cover.
Curated OER
Looking at Data
Third graders use two days to create, collect, display and analyze data. Classroom activities and practice build greater understanding to a variety of forms used to display data.
Curated OER
Mother May I?
Third graders measure distance using nonstandard units of measure. In this measurement lesson, 3rd graders measure a given distance through the use of the game "Mother May I?" Student gather and compare data on how many "giant steps" and...
Curated OER
We Are Family
Pupils explore art and stories that depict families in different cultures. They examine how family members help each other, create traditions, have fun and change or grow. They describe their own families and create a class family album...
Alabama Learning Exchange
How Clouds Form
Young scholars analyze how clouds form. In this cloud formation lesson, learners brainstorm types of clouds and what they think they're made of. Young scholars conduct an experiment to see how clouds form and discuss their observations....
Curated OER
Weather Observation Journal
Students record weather for a period of one month. In this weather lesson, students observe weather for one month on a large pictograph. Students record clouds, wind, temperature and any other weather conditions they observe. Students...
Curated OER
Touch and Discover
Learners identify the physical properties of items using the sense of touch. In this touch and discover lesson, students describe items. Learners sort items using a Venn diagram.
Curated OER
Can You Identify Arthropods?
Third graders sort and classify the four Arthropod classes. They are given puzzle pieces of one Arthropod example. Each group is to put their puzzle together, glue it on a piece of construction paper and label the ir puzzle.
Curated OER
Seeing Life Through An Artist's Eyes
Students examine how art can change the way they look at their lives. After being read a book, they discuss the importance of art in their world and what would happen if it were taken away. They create a watercolor painting and shares...
Curated OER
A Bird's Eye View of our 50 States
Third graders focus on state birds as they learned absolute location (latitude/longitude) of each state, as well as their relative location (bordering states).
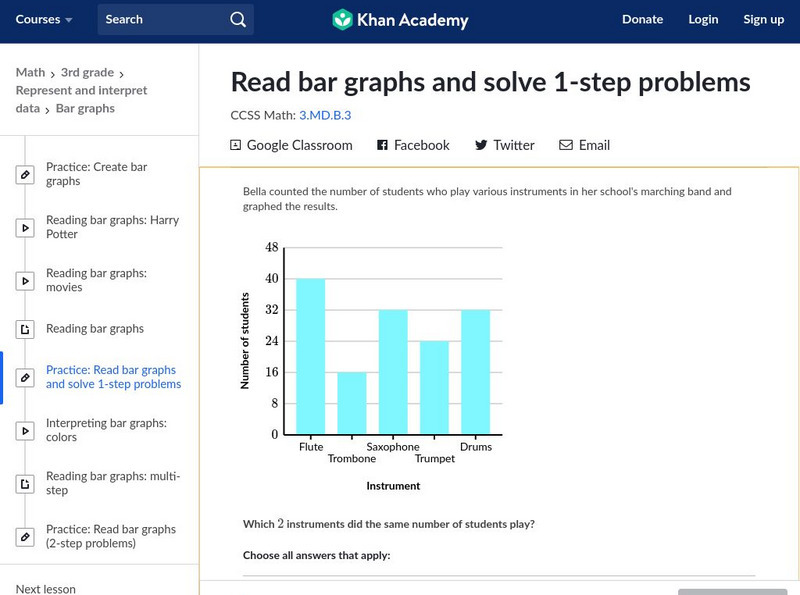
Khan Academy
Khan Academy: Read Bar Graphs and Solve 1 Step Problems
Interpret bar graphs to answer questions about a context. Students receive immediate feedback and have the opportunity to try questions repeatedly, watch a video or receive hints.
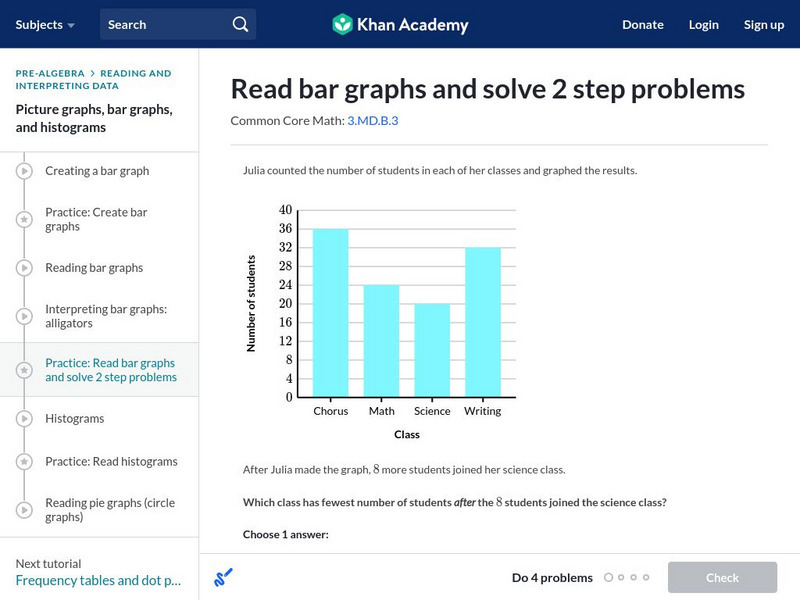
Khan Academy
Khan Academy: Read Bar Graphs and Solve 2 Step Problems
Read and interpret a double bar graphs. Students receive immediate feedback and have the opportunity to try questions repeatedly, watch a video or receive hints. CCSS.Math.Content.3.MD.B.3 Draw a scaled picture graph and a scaled bar...


