Curated OER
Do You See What I See?
Students observe and describe different objects seen under a microscope and compare the individual perspectives of what was seen.
Curated OER
Making Sense of the Census
In this unit of lessons, students make sense of the Census. They examine why a census is taken and participate in activities.
Curated OER
What is a Cloud
Third graders study clouds and how they are formed. They write acrostic poems about clouds and analyze and graph temperature data collected during varying degrees of cloud cover.
Curated OER
On the Road Again": Moving People, Products, and Ideas
For this lesson learners learn how to identify modes of transportation and communication for moving people, products, and ideas from place to place. Students also study the advantages and disadvantages of different modes of...
Curated OER
From Home To School
Young scholars locate and use internet maps to trace a route from their home to school. They calculate the distance of the route using the map legend then determine the distance they travel to school and back in a regular school week...
Curated OER
What is Rock Art?
Students complete the list of vocabulary words and terms and complete the Quick Facts section of a website and answer questions using 2 or 3 sentences from the worksheet about rock art. They then have their names sent to the website and...
Curated OER
Showing Favorites
In this tally chart worksheet, students use the tally chart on the page to answer 2 questions. They then solve the last 2 questions using their own tally chart.
Curated OER
Mother May I?
Third graders measure distance using nonstandard units of measure. In this measurement lesson, 3rd graders measure a given distance through the use of the game "Mother May I?" Student gather and compare data on how many "giant steps" and...
Curated OER
Math Made Easy
Learners evaluate word problems. In this problem solving lesson, students are presented with word problems requiring graphing skills and learners work independently to solve.
Math Is Fun
Math Is Fun: Pictographs
Explains, with examples, what pictographs are and their limitations. Includes ideas for making a pictograph and a set of practice questions.
Other
Lt Technologies: Creating Pictographs With Excel
Concise set of directions teaching how to create a basic pictograph using Microsoft Excel.
ClassFlow
Class Flow: Pictograph Vote
[Free Registration/Login Required] The teacher will use this lesson plan flipchart to review pictographs.
Illustrative Mathematics
Illustrative Mathematics: 3.oa, Md, Nbt Classroom Supplies
The purpose of this task is for students to solve problems involving the four operations and draw a scaled picture graph and a scaled bar graph to represent a data set with several categories. Aligns with 3.NBT.A.2;...
ClassFlow
Class Flow: Pictograph With Key Greater Than 1
[Free Registration/Login Required] This flipchart introduces reading a pictograph with a key greater than one, answering questions from data represented, find number of symbols to represent data by using a key, construct pictograph, and...
ClassFlow
Class Flow: Explore a Pictograph
[Free Registration/Login Required] Use this flipchart to explore a pictograph. Create a pictograph and use the key of the graph to answer questions.
ClassFlow
Class Flow: Pictograph Intro
[Free Registration/Login Required] The teacher will use this lesson plan to introduce pictographs.
Khan Academy
Khan Academy: Create Bar Graphs
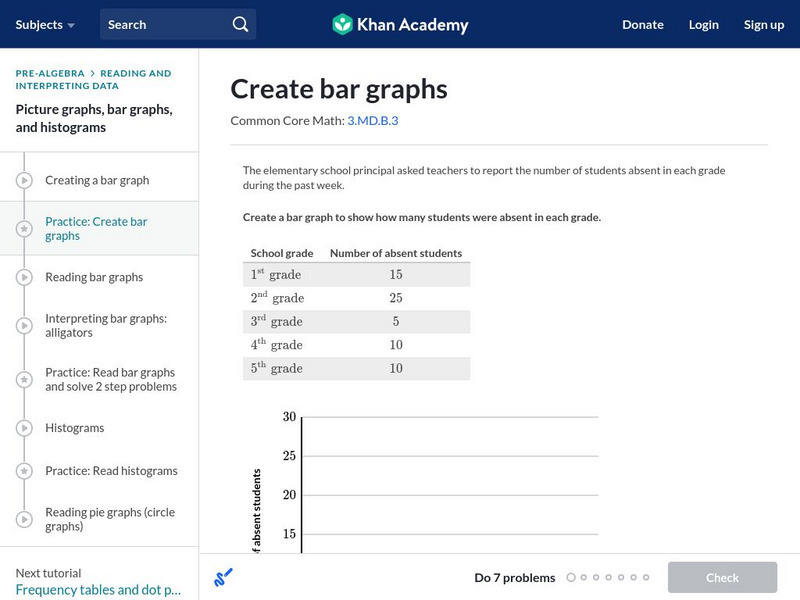
Create a bar graph with the data given. Students receive immediate feedback and have the opportunity to try questions repeatedly, watch a video tutorial, or receive hints about creating bar graphs. CCSS.Math.Content.3.MD.B.3 Draw a...
Khan Academy
Khan Academy: Read Picture Graphs
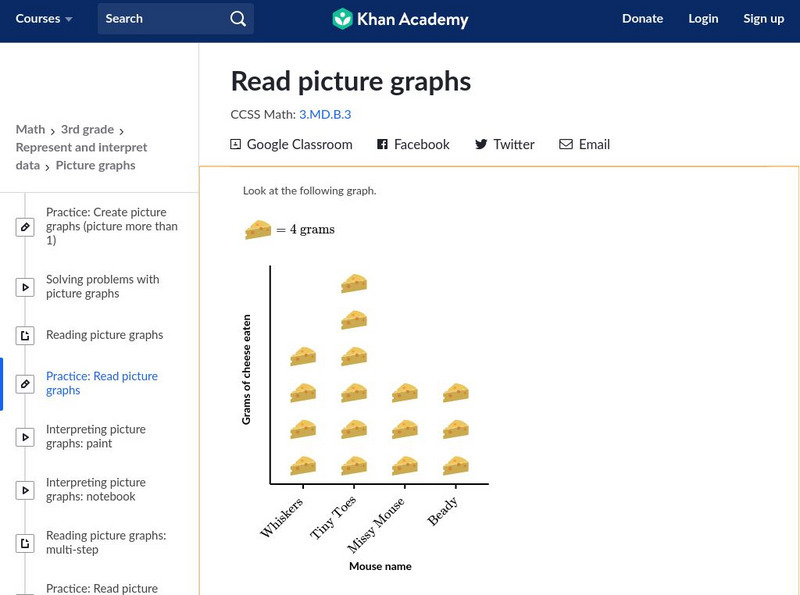
Use picture graphs to solve word problems. Students receive immediate feedback and have the opportunity to try questions repeatedly, watch a video or receive hints. CCSS.Math.Content.3.MD.B.3 Draw a scaled picture graph and a scaled bar...
Khan Academy
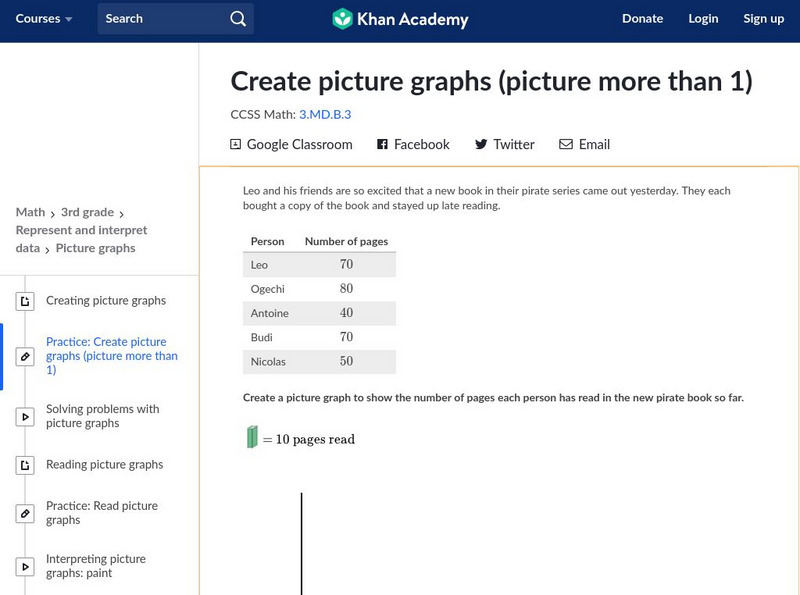
Khan Academy: Create Picture Graphs (Picture More Than 1)
Create and interpret picture graphs. Students receive immediate feedback and have the opportunity to try questions repeatedly, watch a video tutorial, or receive hints about how to create picture graphs. CCSS.Math.Content.3.MD.B.3 Draw a...
Khan Academy
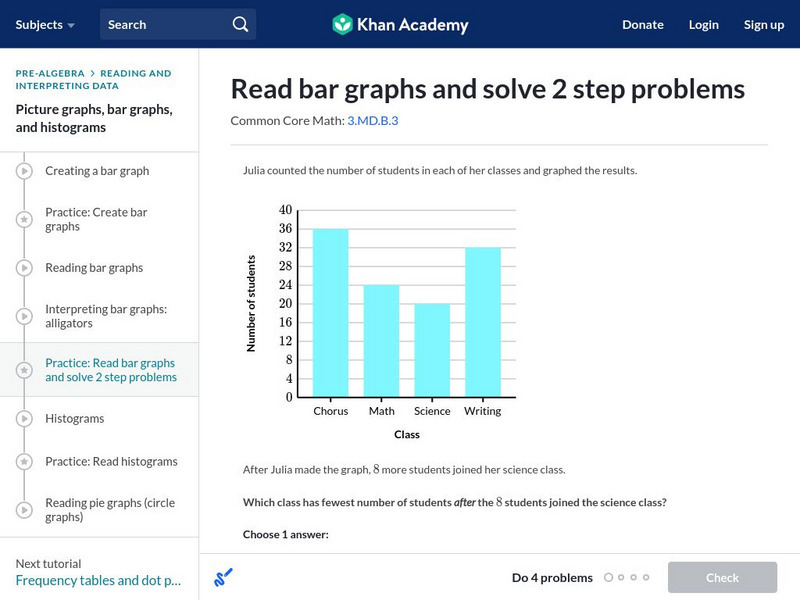
Khan Academy: Read Bar Graphs and Solve 2 Step Problems
Read and interpret a double bar graphs. Students receive immediate feedback and have the opportunity to try questions repeatedly, watch a video or receive hints. CCSS.Math.Content.3.MD.B.3 Draw a scaled picture graph and a scaled bar...
Library of Congress
Loc: The Huexotzinco Codex
Students will analyze a set of pictograph documents created by native peoples of Puebla, Mexico in 1531. Students will take on the role of historians, study the documents, and create a scenario to explain what these documents were for,...
American Geosciences Institute
American Geosciences Institute: Earth Science Week: Rock Art in the National Parks
Students learn the importance of protecting pictographs as part of their geologic heritage by making their own paint using natural ingredients to create art.
Khan Academy
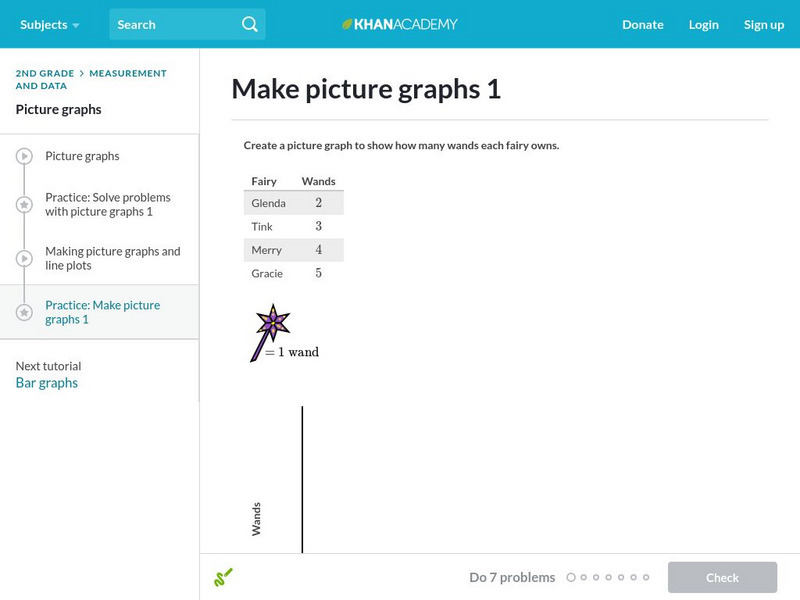
Khan Academy: Make Picture Graphs 1
Practice creating picture graphs (pictographs) from data sets. Students receive immediate feedback and have the opportunity to try questions repeatedly, watch a video or receive hints.
Alabama Learning Exchange
Alex: Writing Native American Style
In this lesson students will reinforce their knowledge about Native Americans and their culture. They will also be introduced to Native American writing. The students will read The Legend of The Indian Paintbrush by Tomie de Paolo to aid...
Other popular searches
- Data Analysis Pictograph
- Pictograph Worksheet
- Bar Graphs Pictographs
- Pictographs and Bar Graphs
- Tally Charts and Pictographs
- Mystery Picture Graph
- Tally Charts or Pictographs.
- Pictograph Stone Carving
- Making a Pictograph
- Math Pictographs
- Math Lessons Pictograph
- Template of Pictograph
