Curated OER
Easter Egg Pictograph
In this pictograph worksheet, students use a given graph to answer questions about Easter eggs found by children and answer related questions. A website reference for additional resources is given.
Curated OER
Pictograph Activity
In this pictograph worksheet, students learn to read a pictograph and answer questions based on the data. Students then draw two of their own pictographs using the given information and answer questions based on graphs.
Curated OER
BBC Bird Pictogram- Math Worksheet
In this British math learning exercise, students develop a pictogram based on the information that is given about what certain types of birds like to eat. They see pictures of the birds and their food preferences before completing the...
Curated OER
Pictograms: Animals in the Zoo
In this math worksheet, students examine a pictogram which shows data about how many of 5 species of animals live in the zoo. Students answer 7 word problems about the pictogram.
Curated OER
Numeracy Practice Math Sports
In this math worksheet, students match the pictographs to find the quantities and write each number sentence. They use the operation of addition.
Curated OER
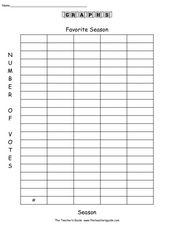
Favorite Season
In this graphing worksheet, learners conduct a survey of people's favorite survey. They then complete 8 questions about the data gathered before creating a bar graph and pictograph on templates.
Curated OER
Pictograms
Have your class practice using a pictogram with this resource. Learners count tally marks, and answer a few questions related to the graph. Afterwards, they could create their own pictograms.
Curated OER
Third Grade Math
In this math review worksheet, 3rd graders answer multiple choice questions about probability, bar graphs, pictographs, and more. Students complete 25 multiple choice questions.
Curated OER
Squigly's Secret Code
In this literacy worksheet, students work to unscramble the secret code. The code is written in symbols that are similar to pictographs.
Curated OER
Pictogram 1 and 2
In this mathematical worksheet, young scholars experience problem solving two pictograms dealing with favorite animals and rainy days.
Mathed Up!
Pictograms
Young mathematicians read, interpret, and complete a variety of real-world pictograms. Each question includes a key and information to complete the graphs.
Curated OER
Math--Pictures and Bars--Learning About Graphs
What is a graph? What does it tell us? How do you make one? These are all questions that are answered in the included packet. It's a great introduction to graphing for young learners!
Math Moves U
Collecting and Working with Data
Add to your collection of math resources with this extensive series of data analysis worksheets. Whether your teaching how to use frequency tables and tally charts to collect and organize data, or introducing young...
Curated OER
Sunshine Math- 2 Earth, IV
For this math problem solving worksheet, students complete 6 problems that include: pictographs, reasoning, basic operations, and money.
Curated OER
The Egg Hunt- Using a Graph to Answer Data Questions
In this pictograph activity, students answer questions based on a pictograph that shows colored Easter eggs. They follow the key that shows that each egg picture is equal to 10 eggs. They fill in the blanks with answers to how many, who...
Curated OER
Graphs #3
In this graphing worksheet, learners use tally marks to create a pictograph of lemonade sold each day. A website reference for additional resources is given.
Curated OER
Graphing Activity #3
For this graph worksheet, students use information in a tally chart to complete a pictograph of favorite pizza toppings and answer 4 related questions. A website reference for additional resources is given.
Curated OER
Picture Graphs
Are your youngsters learning how to read picture graphs? Use these five examples to asess your learners' comprehension. Consider rearranging them differently; the presentation is slightly congested.
Curated OER
Sunshine Math- 2
In this math applications worksheet, students solve 6 varied problems that include estimation, money, basic operations, pictographs and geometry.
Curated OER
Statistics Problems
In this statistics instructional activity, 3rd graders answer questions about different graphs including bar graphs, picture graphs, line graphs, and more. Students complete 20 multiple choice questions.
Curated OER
Make Ten to Add
In this making ten worksheet, students learn to use pictographs or math tables to help them learn to make ten in addition word problems.
K12 Reader
Displaying Data
It's important to learn how to display data to make the information easier for people to understand. A reading activity prompts kids to use context clues to answer five comprehension questions after reading several paragraphs about...
Curated OER
Sunshine Math-1
In this math skills worksheet, students answer 7 questions in which they use various basic math skills. They use number lines, charts, number blocks, a calendar and a ruler to complete this worksheet.
Curated OER
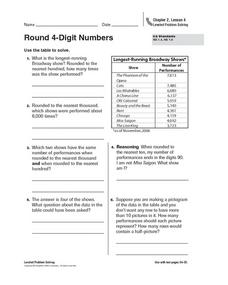
Round 4-Digit Numbers
In this rounding numbers practice worksheet, students sharpen their problem solving skills as they solve 6 story problems that require them to round 4-digit numbers.
Other popular searches
- Data Analysis Pictograph
- Pictograph Worksheet
- Bar Graphs Pictographs
- Pictographs and Bar Graphs
- Tally Charts and Pictographs
- Mystery Picture Graph
- Tally Charts or Pictographs.
- Pictograph Stone Carving
- Making a Pictograph
- Math Pictographs
- Math Lessons Pictograph
- Template of Pictograph


