Curated OER
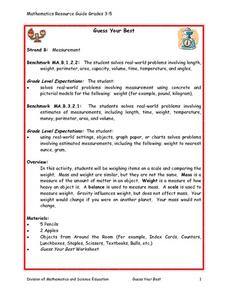
Guess Your Best
Learners discuss situations when it is useful to know exact weight of object as opposed to estimated weight, estimate weight of various items, weigh them on scale using ounces and pounds, and compare their weights on Guess Your Best...
Curated OER
Closer To the Ground Lesson 2: Providing a Helping Hand
Learners examine how businesses and corporations contribute or sponsor activities for the common good. They read annual reports of major corporations to determine how they contribute to focused activities for the common good.
Primary Resources
Primary Resources: Line Graphs and Pie Charts
Here are a few resources to use with your students when teaching about line graphs or pie charts.
US Department of Education
National Center for Education Statistics: Create a Graph Tutorial
This tutorial walks students through how to create different types of graphs using the Create a Graph tool available on the website. Covers bar graphs, line graphs, pie charts, area graphs, scatter plots, and dependent and independent...
National Center for Ecological Analysis and Synthesis, University of California Santa Barbara
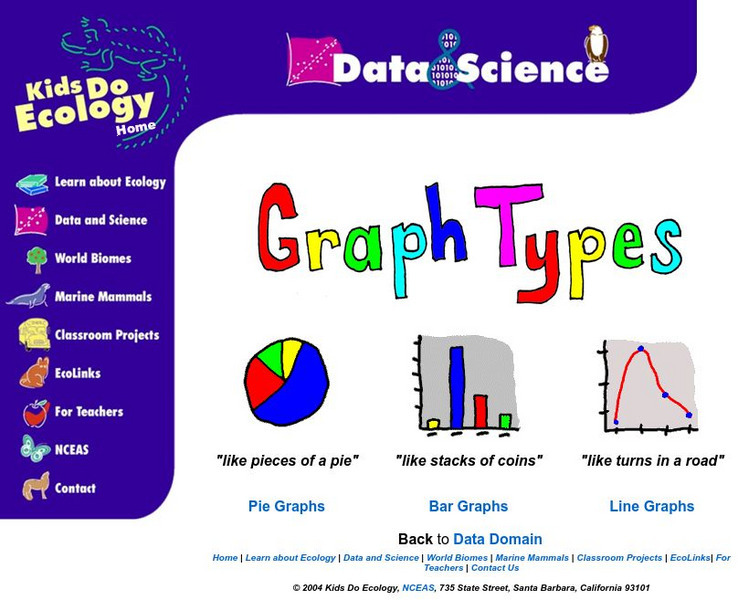
Nceas: Graph Types
At this site from NCEAS you can learn how to organize your data into pie graphs, bar graphs, and line graphs. Explanations and examples are given of each graph along with several questions that check comprehension.
The Math League
The Math League: Using Data and Statistics: Pie Charts
This introductory tutorial about statistical graphing with four examples of how pie charts (circle graphs) are constructed and read.
The Franklin Institute
Frankin Institute Online: Group Graphing
This site from The Franklin Institute explores how to make a simple graph using a spreadsheet to portray survey data. It also gives a set of interesting sports-related web sites so that students can get statistical inforamtion.
Math Is Fun
Math Is Fun: Data Graphs
Create and customize a bar graph, line graph, or pie chart based on a set of data and print it out.
US Department of Education
Nces: Create a Graph: Kids Zone
Make your own pie, bar, line, area or XY graph with this interactive tool. Look for examples of graphs already created from data collected by the National Center for Education Statistics. Complete with a graphing tutorial.
Education Development Center
Tune in to Learning: Reading Charts and Graphs
Practice graph reading skills with these exercises and companion tutorials.
Math Is Fun
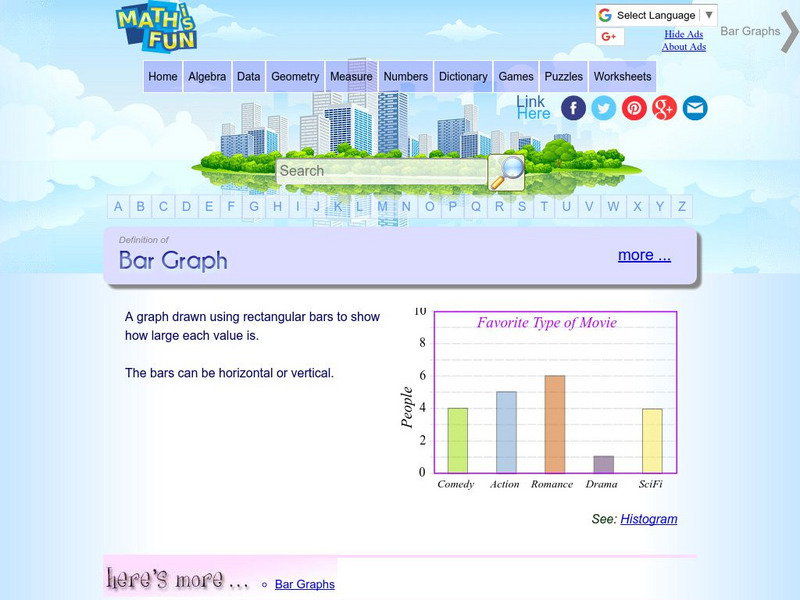
Math Is Fun: Definition of Bar Graph
Get the definition for a bar graph. Then, select the link "here's more" and use the interactive graph to display data as a bar graph, line graph or pie chart. The finished graph may be printed.
ClassFlow
Class Flow: Reading Circle Graphs
[Free Registration/Login Required] Students are asked to figure out the size of the shaded portions of a circle graph. They then complete a chart showing the fraction, decimal, and percentage equivalents.
PBS
Pbs: Mathline Creature Feature Lesson Plan [Pdf]
An interdisciplinary math, science, and language arts lesson plan that engages students in an exploration of statistics. Through a study of various forest climates, students utilize data collection and analysis, classification, and...
American Museum of Natural History
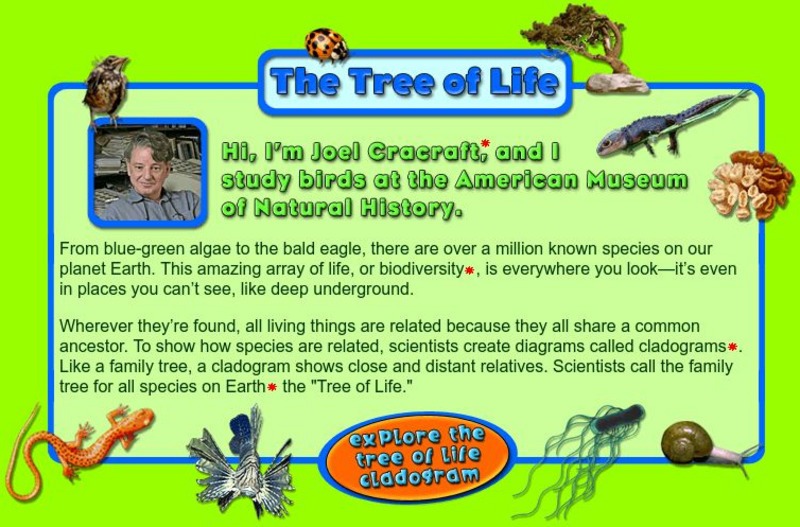
American Museum of Natural History: O Logy: The Tree of Life
Learn about the diversity of species on Earth by exploring a cladogram, a graph-like tree of life that illustrates relatedness among species. Includes instructions for reading cladograms and a pie chart that summarizes the percentages of...
US Geological Survey
Usgs: Water Science for Schools Uses of Saline Water
This U.S. Geological Survey website explains a variety of uses for saline water. Pie graphs and bar graphs are used to illustrate the various uses. Click Home to access the site in Spanish.
The Math League
The Math League: Ratio and Proportion
This tutorial provides definitions and examples of ratios and proportions and features comparing ratios and converting rates.


