Hi, what do you want to do?
Curated OER
Do You See What I See?
Students observe and describe different objects seen under a microscope and compare the individual perspectives of what was seen.
Curated OER
Biome Web Quest
Third graders create paper mache globes, paint them and label the oceans and the continents. In groups, they research a biome, write about it and create an artistic visual representation of the biome and present it to the class.
Curated OER
In Line with Time
Third graders create a timeline of inventions and inventors made out of light colored bulletin board paper.
Curated OER
Closer To the Ground Lesson 2: Providing a Helping Hand
Students examine how businesses and corporations contribute or sponsor activities for the common good. They read annual reports of major corporations to determine how they contribute to focused activities for the common good.
Curated OER
Aiken-Rhett House
Third graders visit the Rhett-Aiken House and discuss the people who lived there. They compare and contrast the lives of slaves who lived there. They practice using new vocabulary and examine the Gullah language and culture.
Curated OER
Seasons' Journey : Putting it All Together
Third graders complete a diagram of the revolution of the earth around the sun and write a one paragraph explanation of the factors that cause seasons.
Curated OER
Instructional Software Resources for Grades K-3
Students become familiar with teh selection, evaluation, and use of instructional software for 4-8 classroom. They download software demos from the web and discuss critiquing software. Students browse software evaluations on web sites.
Curated OER
A Bird's Eye View of our 50 States
Third graders focus on state birds as they learned absolute location (latitude/longitude) of each state, as well as their relative location (bordering states).
Curated OER
Wolves
Young scholars utilize several different sources to research wolves, after completing the K-W-L process.
Curated OER
A Thanksgiving Feast
Learners compare a Thanksgiving feast of today to the Thanksgiving feast of 1621. They analyze information to write a Rebus story about a Thanksgiving feast of today of the Thanksgiving feast of 1621. Pupils describe a typical...
Curated OER
Building a Scale Model
Third graders create a model of the solar system. In this solar system lesson, 3rd graders create a scale model of the solar system. Working in pairs students solve mathematical problems to correctly measure the distance each planet is...
Curated OER
Panther Scavenger Hunt
Students research a website to learn about the Florida panther. In this animal research lesson, students use the scavenger hunt directions to search a website about Florida panthers. Students also solve word puzzles within the activity.
Curated OER
Thank You... Thomas Edison!
Students investigate the life of Thomas Edison. They research how he made a difference. They understand that accurate data collection is important for math. They create a chart using spreadsheet data.
Curated OER
Scavenger Hunt
Students search for items in various parts of the newspaper noting the different types of information it provides.
Quia
Quia: Reading Charts and Graphs Quiz
This 25-question quiz asks students to read various kinds of charts and graphs and to select the correct answers to the questions. Immediate feedback is provided after each question. Java is required.
Education Development Center
Tune in to Learning: Reading Charts and Graphs
Practice graph reading skills with these exercises and companion tutorials.
Read Works
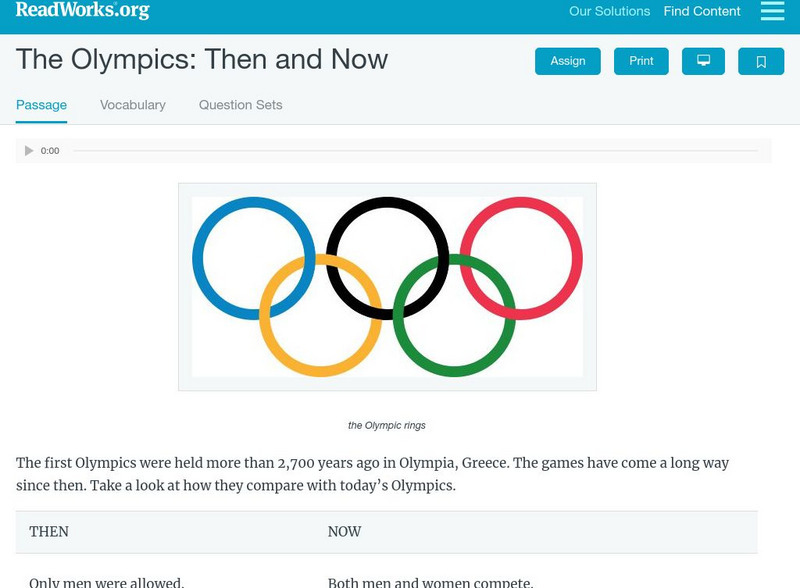
Read Works: The Olympics Then and Now
[Free Registration/Login Required] Students read two charts with information about the Olympics in ancient Greece and in modern times. A question sheet is available to help students build skills in comparing and contrasting.
Other
Super Teacher Worksheets: Reading Comprehension: Hurricanes [Pdf]
Read the fifth-grade reading passages and charts about hurricanes by Erin Ryan and answer the comprehension questions over the selections. PDF includes an answer key with explanations.
The Math League
The Math League: Using Data and Statistics: Pie Charts
This introductory tutorial about statistical graphing with four examples of how pie charts (circle graphs) are constructed and read.
Other
Kim's Korner: Graphic Organizers for Writing and Reading
What are graphic organizers for reading and writing? Use this site to learn more about these learning tools.
Primary Resources
Primary Resources: Line Graphs and Pie Charts
Here are a few resources to use with your students when teaching about line graphs or pie charts.
E-learning for Kids
E Learning for Kids: Math: Tea Store: Reading a Table
Students will demonstrate how to interpret information in a table.
English Zone
English Zone: Chart Reading Practice 1
Practice reading and understanding information when it is provided in chart format. This website provides a simple chart and asks questions about the chart's information, which can be answered and checked.
American Museum of Natural History
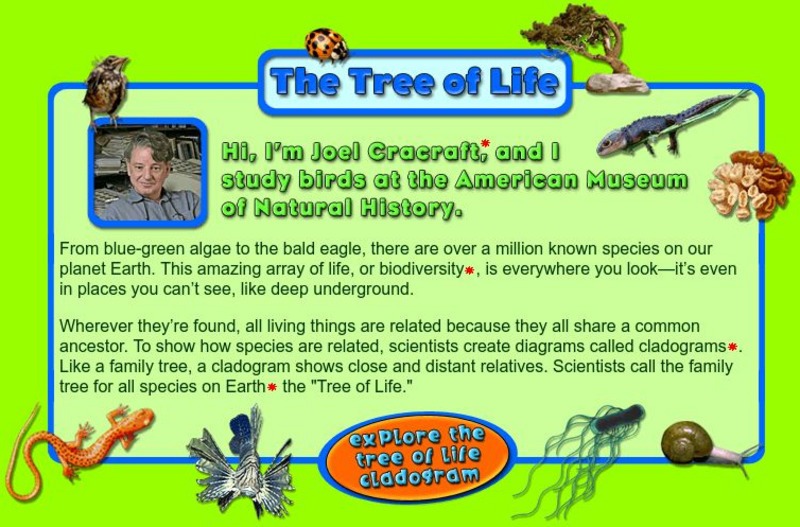
American Museum of Natural History: O Logy: The Tree of Life
Learn about the diversity of species on Earth by exploring a cladogram, a graph-like tree of life that illustrates relatedness among species. Includes instructions for reading cladograms and a pie chart that summarizes the percentages of...


![Super Teacher Worksheets: Reading Comprehension: Hurricanes [Pdf] Handout Super Teacher Worksheets: Reading Comprehension: Hurricanes [Pdf] Handout](https://static.lp.lexp.cloud/images/attachment_defaults/resource/large/FPO-knovation.png)


