The Math League
The Math League: Using Data and Statistics: Pie Charts
This introductory tutorial about statistical graphing with four examples of how pie charts (circle graphs) are constructed and read.
US Geological Survey
Usgs: Water Science for Schools Uses of Saline Water
This U.S. Geological Survey website explains a variety of uses for saline water. Pie graphs and bar graphs are used to illustrate the various uses. Click Home to access the site in Spanish.
Other
Kim's Korner: Graphic Organizers for Writing and Reading
What are graphic organizers for reading and writing? Use this site to learn more about these learning tools.
Primary Resources
Primary Resources: Line Graphs and Pie Charts
Here are a few resources to use with your students when teaching about line graphs or pie charts.
Math Is Fun
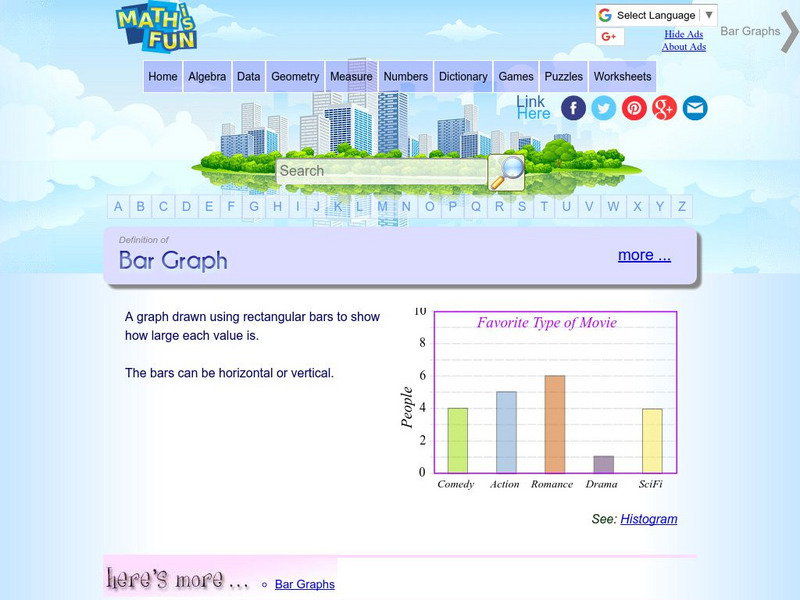
Math Is Fun: Definition of Bar Graph
Get the definition for a bar graph. Then, select the link "here's more" and use the interactive graph to display data as a bar graph, line graph or pie chart. The finished graph may be printed.
TeachEngineering
Teach Engineering: Engineering for the Earth
Young students are introduced to the complex systems of the Earth through numerous lessons on its natural resources, processes, weather, climate and landforms. Key earth science topics include rocks, soils and minerals, water and natural...
The Math League
The Math League: Using Data and Statistics
This site contains two short examples of line graphs, charts that show change over time. This is a quick introduction to the topic of statistical graphing.
University of Texas
Inside Mathematics: Parking Cars [Pdf]
This task challenges a student to use their understanding of scale to read and interpret data in a bar graph.
University of Cambridge
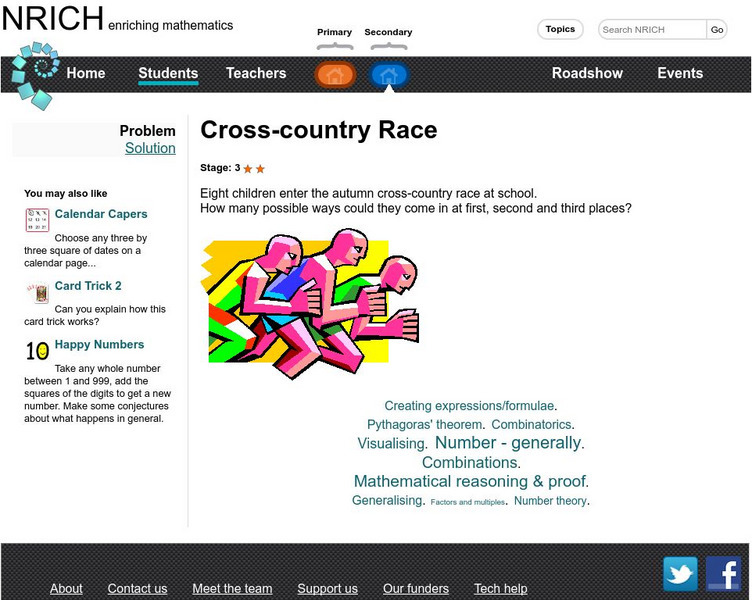
University of Cambridge: Nrich: Cross Country Race
On this one page website sharpen your logic and problem solving skills while working on this challenge. The solution is available to double check your solution.
Scholastic
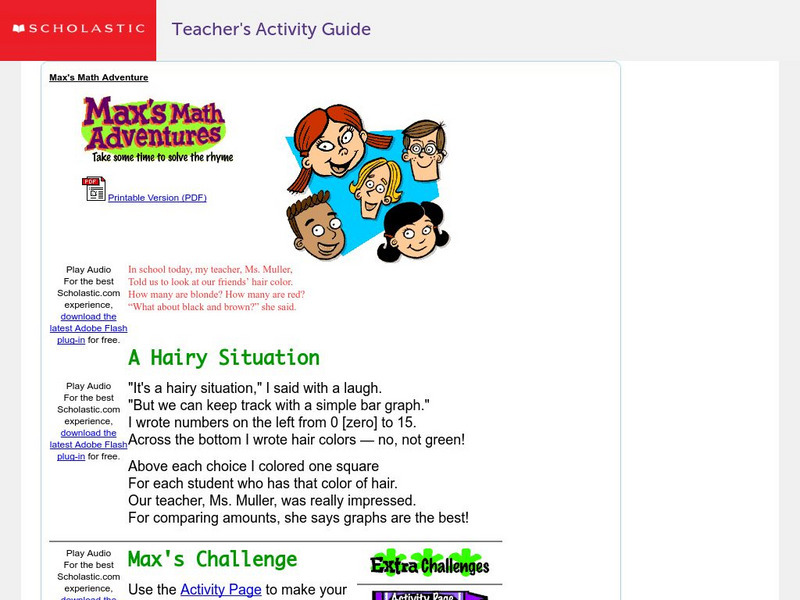
Scholastic: Max's Math Adventures: A Hairy Situation
Help Max make a bar graph to show the hair colors of his classmates. Teachers will appreciate the activities with bar graphs in the extra challenges. Use the teacher's guide to create a fun and engaging lesson.
Other
Laus Dnet: Grade 5 Excel Lesson Plan
In this online lesson, students will survey students in their school to determine their favorite type of hand-held ice cream. Before performing the survey, students will make predictions about which ice creams they think will be the...
Florida Center for Reading Research
Florida Center for Reading Research: Exp. Text Structure: Text Feature Find
A lesson plan in which students look through a book to find various text features including: a table of contents, sequence and format, charts/graphs/maps, diagrams/graphics/illustrations, print variations, an index, and a glossary....
English Zone
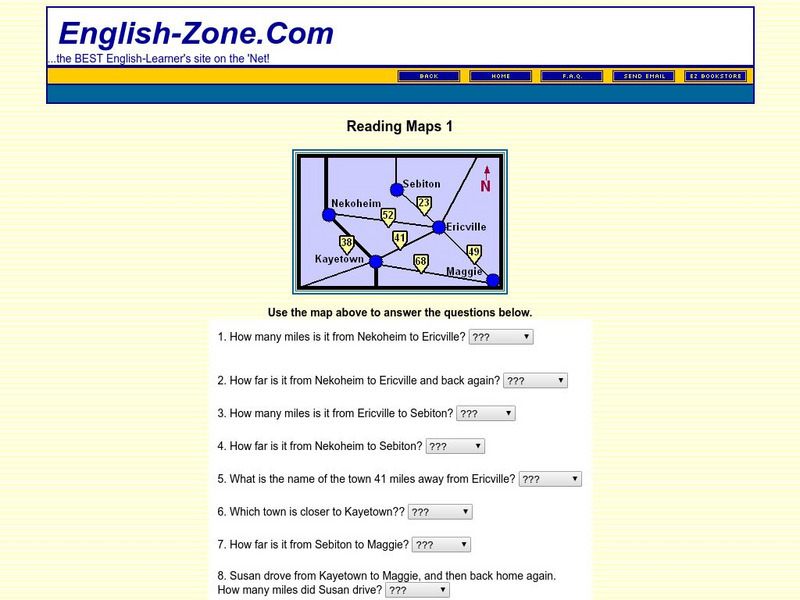
English Zone: Reading Maps 1
Using the map provided, students are to answer questions such as how far is it from one town to another.


