Curated OER
Graphs - Online Activity
In this interpreting graphs worksheet, students complete an on-line activity in which they read both a line graph and a bar graph. They answer questions about how many of each letter is shown on a line graph and how many of each child's...
Curated OER
Build A Skittles Graph
Students explore graphing. In this graphing lesson, students sort Skittles candies and use the color groups to create a bar graph. Rubrics and extension activities are provided.
Curated OER
Graphing With Candy
Students gather information and interpret the results using a tally chart, a table, and a bar graph.
Curated OER
Make a Graph
For this graphing worksheet, 1st graders use given data to create a graph and answer questions. In this problem solving worksheet, students solve five problems.
Curated OER
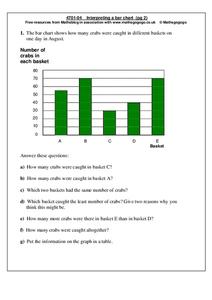
Interpreting a bar chart
In this bar chart worksheet, students analyze a bar chart and answer 7 questions pertaining to the information on the chart. The answers are on the second page.
Curated OER
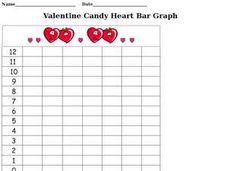
Valentine Candy Heart Bar Graph
In this Valentine candy heart bar graph worksheet, students complete a bar graph illustrating how many different colored candy hearts they received for Valentine's Day.
Curated OER
Math Who Am I?
In this math vocabulary worksheet, students read each description of a math term and write the word on the blank line. They circle every third letter in each letter box next to the clue to check their answer. They complete 8 definitions.
Curated OER
Sunshine Math-1
In this math skills worksheet, students answer 7 questions in which they use various basic math skills. They use number lines, charts, number blocks, a calendar and a ruler to complete this worksheet.
Jude Mphoweh
Coordinates
This coordinate graphing lesson gives your young graphers practice graphing points on these rectangular coordinate grids.
Curated OER
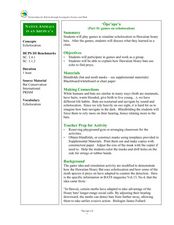
Games on Echolocation
Get a little batty with life science! This fun simulation game replicates how bats use echolocation to hunt moths in their native Hawaiian habitat. After creating blind folds and discussing some basic principles of echolocation, students...
Curated OER
Best-Selling Books Bar Graph
Create a bar graph with your elementary school learners. First they read and interpret data, and then they color in the graph (provided) to indicate how many of each were sold. Consider providing them with the data but having them...
Curated OER
Popcorn Math
Everyone loves popcorn! Use this treat to teach math concepts including place value, estimating, graphing, and volume. Eight possible activities are included, and they can be modified to fit all grade levels.
Curated OER
Have You Looked Outside? Lesson #5- Graphing Weather Conditions
First graders study daily weather changes. In this weather and graphing lesson, 1st graders chart the daily weather for a month using stickers or weather symbols. They graph the weekly weather so that at the end of the month students...
Curated OER
Graphing Our Snacks
Students gather information from Nutrition Facts labels on their favorite snack foods. They graph the fat content of the foods and reflect on what they see.
Curated OER
Play Battleship on Graph Paper
Who says learning can't be enjoyable? Your class will love identifying the x axis and y axis of a coordinate plane and plotting various points when it's dressed up in the guise of a Battleship game. Rather than sets of the actual game,...
Curated OER
All Kinds of Hats Graphing Fun
Where are the hats located? A graphing activity has mathematicians finding coordinates to give exact locations of ten hats scattered on a grid. An example is done for them. Consider showing learners this skill by putting hats around...
Curated OER
Treasure Hunt: Coordinate Graphing
Two of the best words any one can hear– treasure hunt! Your class will be excited to practice graphing on a coordinate grraph as they identify and write coordinates for landmarks they see on a treasure map. They trace their route to the...
Curated OER
The Math Of African Music
Students practice rhythms and fractions on African drums in this Music lesson plan mixing Math skills and music notation. The lesson plan also includes ideas for assessment and state and national benchmarks met.
Curated OER
Going Bananas: Addition and Graphing
In this addition worksheet, 1st graders will look at a picture to add the total number of bananas a monkey eats per day for five daily sums. Then students will answer four short word problems which require students to view the data as a...
Curated OER
Sunshine Math--3: Mars, II
Students practice solving mathematical word problems. In this math worksheet, they solve one probability problem, write in the missing numbers in a table, solve one mental math problem and interpret two graphs.
Curated OER
Sunshine Math- 1 Venus, III
In this problem solving worksheet, students complete 7 problems that include: reasoning, basic operations, graphs, tables, geometry and math puzzles.
US Department of Commerce
Immigration Nation
People come and people go. Given tabular census data on the annual number of immigrants from four different regions of the world between 2000 and 2010, pupils create double bar graphs and line graphs from the data. They analyze their...
Curated OER
Blank Bar Graph
For this math graphing worksheet, students use a blank bar graph grid to display data. The intervals are counting by 2, up to 14. There are no problems provided.
Curated OER
Favorite Apple Graph
First graders record their favorite type of apple in the form of a graph. They each try one slice of a Red Delicious, Golden Delicious, and Granny Smith apple, select their favorite type, and create a class graph using the data collected.
Other popular searches
- Charts and Graphs Math
- Hidden Picture Math Graphs
- Misleading Graphs Math
- Powerpoint Math Graphs
- 1st Grade Math Graphs
- Math Graphs 4th Grade
- Math Reading Graphs
- Animals Math Graphs
- Math Graphs Grade 1
- Creating Math Graphs
- Math Graphs Using M&ms
- Math Interpreting Graphs


