Curated OER
Animal Runners
In this collecting data worksheet, 4th graders use the data shown on how fast 6 animals can run to create a bar graph. Students follow the instructions on 3 directives for their bar graphs and answer 1 short answer question.
Curated OER
Location on a Grid
Make coordinate pairs more engaging by having beginners color-code a grid based on given locations. The grid has numbers along the y-axis and letters along the x-axis, introducing them to the ordering of coordinate pairs with the x-axis...
Curated OER
Food chains at sea
Fifth graders interpret a table of data about food chains in the ocean. They create a food chain to represent the information on the table. Periwinkles eat seaweed, and crabs eat periwinkles - so who eats crabs? Extend the activity with...
Curated OER
"who Lives in Your House?"
Fourth graders collect data about the people and animals living in their homes, and the students' shoe sizes. They work in groups to enter the information into a database from which they create graphs. They analyze the data to find the...
Living Rainforest
Finding the Rainforests
From Brazil to Indonesia, young scientists investigate the geography and climate of the world's tropical rain forests with this collection of worksheets.
Curated OER
Tracking the Wild Ones
Students apply mathematic skills to discover the extent of the concern for endangered species. Students analyze graphs and look for trends in graphed results of endangered species on a global level.
Curated OER
Fourth Grade Mathematics Quiz
For this math worksheet, 4th graders complete multiple choice questions about multiplication, bar graphs, rounding, and more. Students complete 15 questions.
Curated OER
Critter Encounter Chart
Students record data found at an assigned web site. In this data collection lesson, students access an assigned web site in order to complete a data chart about animals they see. They travel to different sections of the web site to find...
Curated OER
Pets All Around
In this information table learning exercise, students will survey their classmates to find out what types of pets they have at home and record the information using tally marks on a table. Then students will answer 6 short questions...
Curated OER
When Dinosaurs Ruled the World
Students graph the varying sizes of dinosaurs. In this math and dinosaur lesson, students view dinosaur models and compare the different shapes and sizes of the dinosaurs. Students complete a dinosaur math activity, read The...
Curated OER
Wolves
Students explore wolves. In this ecology and wolves lesson, students research predator-prey relationships on the Internet and complete a related worksheet with a partner. Students interpret data on bar graphs to determine growth and...
Curated OER
Pets Galore!
Fourth graders conduct a class survey on the number of pets that the 4th grade owns and they record that data in their math notebooks. They make a bar graph displaying the results using a spreadsheet through Microsoft Excel.
Curated OER
Savanna Animals
In this Savanna animals worksheet, students color a picture of an ostrich and complete a blank graph underneath it. Students color 1 picture and complete 1 graph.
Curated OER
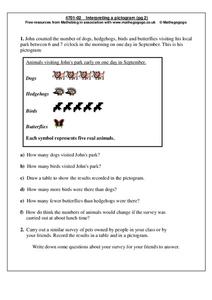
Interpreting a Pictogram
In this pictogram worksheet, learners read and analyze a pictogram about dogs, hedgehogs, birds and butterflies and then answer 6 short answer questions. Students conduct a similar survey on pets owned by their friends and put their...
Curated OER
The Great Pollinators
Young scholars discover the reproductive parts of a plant. In this biology lesson, students identify and categorize several different plants they dissect in class. Young scholars record their information using a data chart.
Curated OER
The Life Cycle of the Mealworm
Fourth graders provide a habitat for live mealworms and observe their life cycle. In this animal life cycle and scientific inquiry instructional activity, 4th graders create a habitat for a live mealworm and observe and record related...
Curated OER
Animal Survey
In this mathematical worksheet, students survey sixteen people to find out if their animals lay eggs or give birth to their young and then graph out their findings.
Curated OER
Exploring Regions of Our World
Examine how climate and landforms affect plants and animals that live in particular areas. Discover that these same factors affect peoples' homes, jobs, and recreational activities. Pupils research ecosystems and biomes, and then write...
Curated OER
Living in the Desert
Conduct an investigation on the plants used by the Hohokam tribe. To survive in the harsh desert environment the Hohokam used many natural resources. Learners read, research, map, and graph multiple aspects of Hohokam plant use as a...
Curated OER
'The Flood'
Students hear the story "The Flood," and take a survey of the favorite pet animals in the class. They take the information complied in the survey and make a bar graph to show favorite pet animals using the computer program KidPix.
Curated OER
Manatee Awareness Survey
Students examine the public's awareness of manatees by taking a survey. They display the results of the survey as a graph.
Curated OER
Paper Bag Skits
Young scholars discover math measurements by creating a skit with classmates. In this geometry lesson plan, students utilize objects in a paper bag and index cards to create a short skit focusing on debate over the size of the...
Curated OER
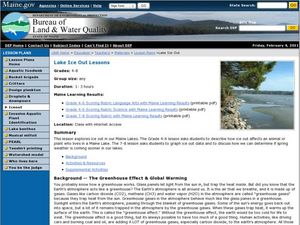
Lake Ice Out Lessons
Students explore the greenhouse effect. In this environment instructional activity, students describe how "ice out" affects animals and plants who live in a Maine lake. Students graph "ice out" data and make predictions about...
Curated OER
Those Amazing Seaworld Animals
Students research the animals at SeaWorld and then relate the info they have found into various types of graphs; line, circle and bar. This lesson combines math and science nicely. They access a website imbedded in this plan to do their...


