Curated OER
Graph Made Easy-Pre Test Questions
In this graphing pre test learning exercise, students complete a set of 10 multiple choice questions. Page is labeled as a pretest, an answer link is provided.
Curated OER
Graphs Abound
Students create a survey for their classmates to collect data on their favorite foods, eye color, pets or other categorical data. They compile the data from the survey in a table and then make a bar graph of each category using a web tool.
Curated OER
Let's Graph It!
Students graph the height of others in centimeters and inches, find the slope of line in order to calculate the conversion factor between centimeters and inches.
Curated OER
Coin Count & Classification
Students make a prediction about how 100 pennies sort by decade or year and then test their predictions. They organize their data using a graph that is imbedded in this lesson.
Curated OER
Data Analysis, Probability, and Discrete Mathematics
Fourth graders analyze the data in a bar graph, pictograph, line graph, and a chart/table and draw conclusions based on the data. They discuss each type of graph, write questions for each graph, and analyze the data as a class.
Curated OER
On the Road Again
Students work with patterns to develop formulas that will help them determine total cost. In this patterning activity, students watch a video about an NBA trainer. (not included) They work in groups to access the assigned Internet...
Curated OER
A Class Census
Students recognize that data represents specific pieces of information about real-world activities, such as the census. In this census lesson, students take a class and school-wide census and construct tally charts and bar graphs to...
Curated OER
Pumped Up Gas Prices
Students calculate gas prices. In this transportation lesson, students tally the mileage and gas costs of their car for one months. They figure out how much was spent on gas and create a graph showing average gas prices over time.
Curated OER
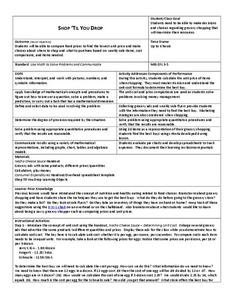
Shop 'Til You Drop
Students evaluate food prices. For this real world math lesson plan, students compare the cost of various grocery items to determine which is the best deal. They work in groups using grocery ads to decide how to get the most product for...
Curated OER
Temperature
For this temperature worksheet, students color a thermometer to depict the given temperature. They then compare, contrast temperatures and answer given thinking questions. There are approximately 20 questions on this one-page...
Curated OER
A World of Information
Students analyze data and statistics about countries around the world. They read graphs and charts, color a world map to illustrate the top ten statistics about the world, and write a paragraph to summarize their information.
Curated OER
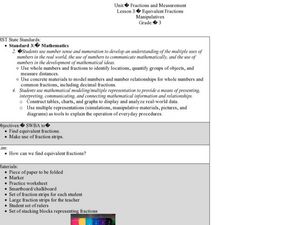
Equivalent Fractions Manipulatives
Students study fractions. In this equivalent fractions instructional activity, students utilize fraction strips to enhance their understanding of equivalent fractions. They watch a demonstration and then work independently with their own...
Curated OER
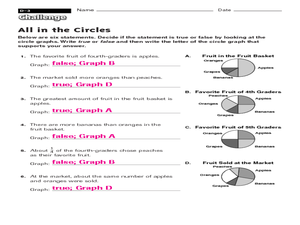
All in the Circles
In this circles worksheet, students use 4 circle/pie chart graphs to answer a set of 6 questions. Answers are included on page 2.
Curated OER
Cold Enough?
Students read and record temperatures and display the data. They represent the temperatures on an appropriate graph and explain completely what was done and why it was done. Students display the data showing differences in the daily...
Curated OER
Let's Go Shopping
In this fraction and pie chart worksheet, students draw a line from the toys with the prices of 50 cents, 75 cents, and 25 cents to the pie chart that show the part of a dollar the toy costs.
Curated OER
Harry Potter Research Project
Students work together to complete a research project on Harry Potter. They write a research question and develop a survey to give to their classmates. Using the results, they create a graph and draw conclusions about the data collected.
Curated OER
Picnic Possibilities
Fourth graders plan a picnic using weather data. Using accumulated weather data from various sources, they create a graph of the weather conditions in their region for a given period of time. Students interpret this data to predict the...
Curated OER
How Does Your Blue Bonnet Grow?
Students explore the conditions needed to grow Texas Blue Bonnets. In this Blue Bonnet planting activity, students recognize the differences in Texas Blue Bonnet. Students record their findings in a graphs and analyze their results.
Curated OER
Growing Up With A Mission
Student measure heights and graph them using growth charts for which they find the mean, mode, and median of the data set. They graph points on a Cartesian coordinate system.
Curated OER
Cloud Observation and Graphing
Students identify the three major cloud groups. They are introduced to the three main cloud types and spend a week making and recording observations of clouds. Students produce a graph that presents their findings and conduct research...
Curated OER
How Much Will I Spend On Gas?
Students construct a linear graph. In this graphing lesson, students determine a monthly budget for gasoline. Students construct a t-chart and coordinate graph to display data. Resources are provided.
Curated OER
Mathematical Magazines
Students classify and tabulate the type of advertisements found in a collection of magazines. Determination is made on what percent of the total number of ads each type represents. They present their results orally and in a graph.
Curated OER
Atlatl Lessons for Grade 4
Fourth graders explore the weapons of the Aboriginal people. In this fourth grade math lesson, 4th graders create charts, tables, or diagrams to represent patterns and relations. Students investigate which dart length has the...
Curated OER
Weather Report Chart
Students complete a weather report chart after studying weather patterns for a period of time. In this weather report instructional activity, students measure temperature, precipitation, cloud cover, wind speed, and wind direction for a...


