Curated OER
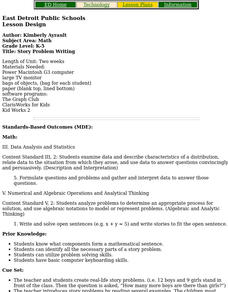
Story Problem Writing
Students write story problems which can only be solved with the application of multiplication facts. They write an extra fact that isn't needed to solve. When their partners do the problems, they must cross out the fact that they do need.
Curated OER
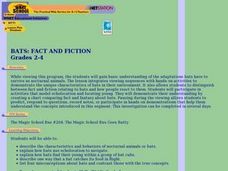
Bats: Fact and Fiction
Students describe the characteristics and behaviors of bats. After viewing a video, they explain how bats use echolocation to navigate and how they find their young within a group. They list four misconceptions about the animal and...
Curated OER
What in the World..?!?
Students photograph mystery images. In this observation skills lesson, students gather everyday objects and place them under a digital microscope. They magnify the image and take a photograph of it. The image is then displayed on the...
Curated OER
Burs in Your Furs
Students explore the concept of animal welfare. In this wild animal habitats lesson plan, students discover the work of wild animals in sustaining their habitats as they participate in a classroom simulation. Students discuss how...
Curated OER
Peekikng At Public Sculpture
Young scholars use the internet to investigate public examples of sculpture. They reflect upon the possibility of being a reference of lifestyles that can exist in a society. A variety of media sources serve as inspiration for the lesson.
Curated OER
It's A Jungle Out There!
Students report on an animal according to its appearance, habitat, and characteristics.
Curated OER
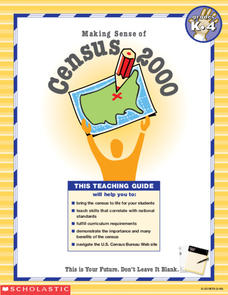
Making Sense of the Census
In this unit of lessons, students make sense of the Census. They examine why a census is taken and participate in activities.
Khan Academy
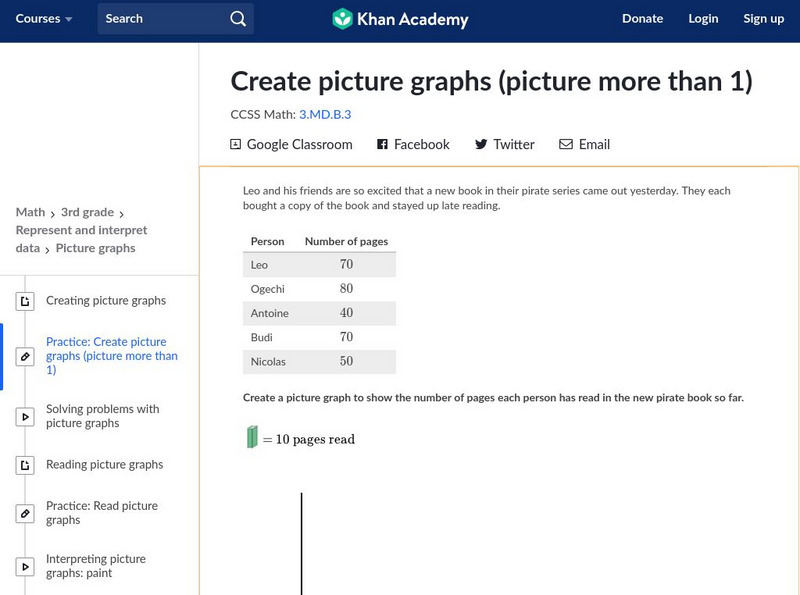
Khan Academy: Create Picture Graphs (Picture More Than 1)
Create and interpret picture graphs. Students receive immediate feedback and have the opportunity to try questions repeatedly, watch a video tutorial, or receive hints about how to create picture graphs. CCSS.Math.Content.3.MD.B.3 Draw a...
Khan Academy
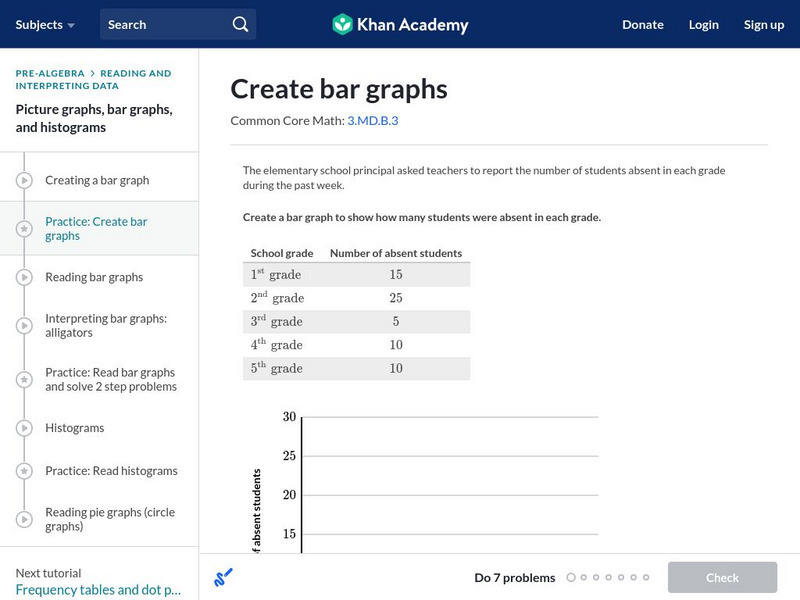
Khan Academy: Create Bar Graphs
Create a bar graph with the data given. Students receive immediate feedback and have the opportunity to try questions repeatedly, watch a video tutorial, or receive hints about creating bar graphs. CCSS.Math.Content.3.MD.B.3 Draw a...
Rice University
Rice University: Cynthia Lanius: Let's Graph
An introduction to bar graphs, both vertical and horizontal in nature. The interactive aspect of this site allows students to change the values of the data - their favorite cafeteria foods - and then see how the graph is changed.
Math Is Fun
Math Is Fun: Activity: An Experiment With a Die
Explore probability with this dice experiment. Includes instructions for recording data on a table, creating a graph, questions to investigate, a probability formula, and a discussion of probability.
ABCya
Ab Cya: Fuzz Bugs Graphing
Students drag the fuzz bugs into the correct container to create a bar graph that is used to compare data.
Scholastic
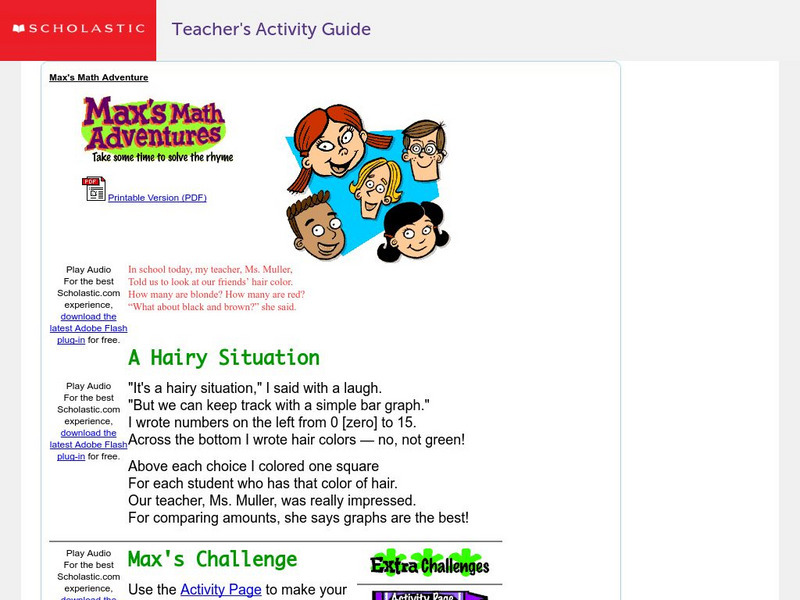
Scholastic: Max's Math Adventures: A Hairy Situation
Help Max make a bar graph to show the hair colors of his classmates. Teachers will appreciate the activities with bar graphs in the extra challenges. Use the teacher's guide to create a fun and engaging lesson.
Math Is Fun
Math Is Fun: Data Graphs
Create and customize a bar graph, line graph, or pie chart based on a set of data and print it out.
Better Lesson
Better Lesson: Graphing Meaningful Data
Learners use their timed test scores to create a bar graph that compares their progress in learning math facts.
Better Lesson
Better Lesson: A Short Lesson in Graphing Ordered Pairs
Fourth graders practice graphing ordered pairs on IXL math and on a worksheet to create a picture.
Scholastic
Scholastic: Study Jams! Math: Data Analysis: Pictograph
Watch short video clips that show step by step how to organize data and create a pictograph. Then check for understanding by testing yourself.
Alabama Learning Exchange
Alex: Tulip Graphing
Young scholars will create an on-going graph using units of measurement correctly. This graph will represent the growth of a tulip (or other type of flower).This lesson plan was created as a result of the Girls Engaged in Math and...
Houghton Mifflin Harcourt
Houghton Mifflin Harcourt: Saxon Activity Center: Real World Investigation: Elevation Changes [Pdf]
Math and geography are the focus of this internet investigation. Learners must plan a road trip to several cities and plot the elevations of those cities using a line graph. Acrobat Reader required.
K-5 Math Teaching Resources
K 5 Math Teaching Resources: Two Step Number Patterns [Pdf]
The student learns how to create number patterns involving addition and subtraction.
That Quiz
That Quiz
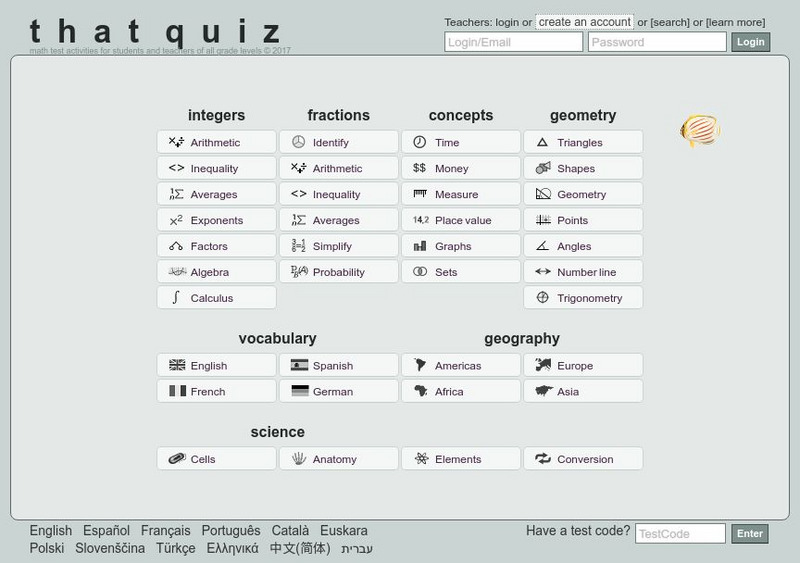
ThatQuiz is an excellent assessment tool for teachers and students. At this site, teachers can create individualized or group assessments on a variety of math topics. Students take these practice assessments directly online and receive...
Alabama Learning Exchange
Alex: "Ridin' Along in My Automobile"
Students will research prices of used cars to discover how automobiles lose their value over time. Students will create a chart to record their information, use their chart to graph their data, and find measures of central tendency of...
Khan Academy
Khan Academy: Graph Data on Line Plots
Record measurements on line plots (also called dot plots). Students receive immediate feedback and have the opportunity to try questions repeatedly, watch a video or receive hints.
US Department of Education
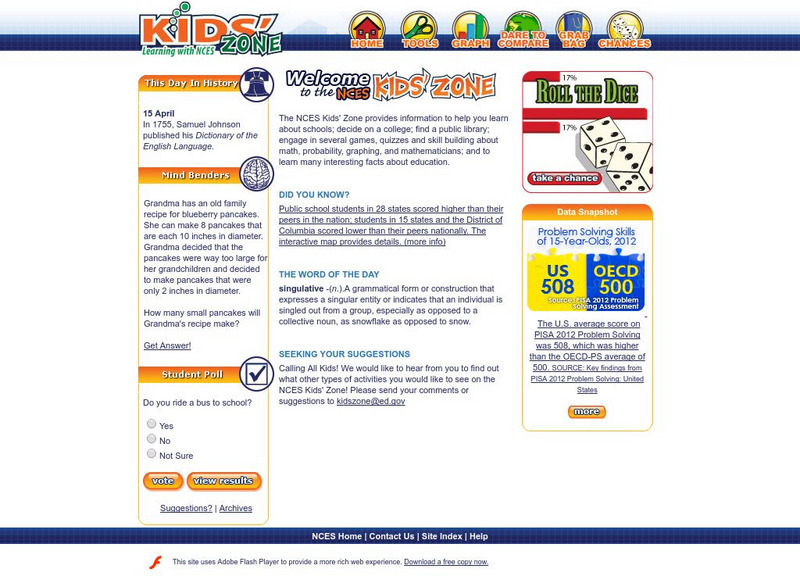
National Center for Education Statistics: Nces Classroom
Just what is the NCES Students' Classroom? In addition to many useful features, this site provides math and statistical activities tailored to a middle and elementary school students.
