Curated OER
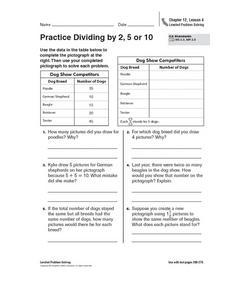
Practice Dividing by 2, 5, or 10
In this pictograph problem solving worksheet, students analyze the data on a table and create a pictograph. Students read and solve 6 story problems about the pictograph.
Florida Center for Instructional Technology
A Human Number Line: Teacher Notes
Twenty-one pieces of tagboard can lead your class to a greater understanding of integers when you use them to form a human number line. After creating this math tool, two strategies for adding and subtracting will have your...
Curated OER
The Square Counting Shortcut
An excellent lesson that encourages students to discover how complex figures can be broken into simpler shapes when measuring area. Working with block letters, learners are given the freedom to develop their own strategies for...
Curated OER
M&M Math
Learners sort a bag of M&M candies according to color using a sorting mat. They count M&M candies. They compare the number to their prediction then students create tally charts.
Curated OER
Survey Says...
Students practice taking surveys to answer different questions about radio. In this communications lesson, students brainstorm to create questions they can ask strangers about how often they listen to their radio. Students...
Curated OER
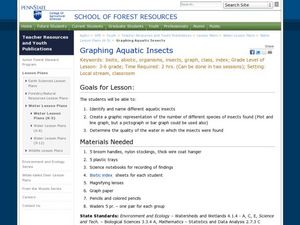
Graphing Aquatic Insects
Students identify aquatic insects. In this organism instructional activity, students locate aquatic insects near a local waterway and collect them. Students graph the amount of insects that they collected.
Curated OER
A Thanksgiving Survey
Young scholars take a survey then use the information gained from the survey to help plan a typical Thanksgiving dinner for our last day of class. They create a graph which corresponds the the data gathered during interviews.
Curated OER
Circles Minilab
Students learn how to measure the diameter and circumference of a circle. In this circle activity, students organize their data to create a graph. Students utilize their graph to make an inference about the slope of pi.
Curated OER
Buzzy, Buzzy Bee
Students simulate honeybees pollinating flowers. In this pollination lesson, students role-play the process of pollination over the course of several seasons. Students graph results and share their graphs with the class.
Curated OER
Garden Grid
Basically, your class reads about different garden plants from an included handout and seed packets that you provide, and then uses a grid to plan out where to place the plants. They can practice counting with the seeds, grouping,...
Curated OER
Integrating Math and Science
Student understanding of math concepts improves when math is integrated with science!
Curated OER
Getting A Grip On Graphs
Fourth graders investigate the concept of graphing and comparing different types of data using pictographs, line graphs, scatter plots, etc... They gather data and make interpretations while examining the medium of how it is displayed.
Curated OER
Grand Grocery Graphs
Students experience creating their own graphs on graph paper and the computer program "Graph Club." They approach this task by utilizing food as their primary source for the activities. In addition, they interact with their peers as they...
Curated OER
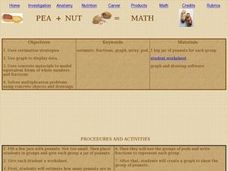
Pea+Nut = Math
Students utilize peanuts to practice fractions. In this math model lesson, students solve multiplication problems and fractions with real peanuts. Students use drawing software to graph data from the math equations.
Curated OER
Fun Creative Activities that Teach Math
Students have fun with math. In this math skills lesson, students collaborate to solve the problems presented in this interactive lesson. The problems pertain to geometry, measurement, probability, number sense, and algebra.
Curated OER
Horizontal Bar Graph: Changes in Nebraska Population
In this bar graph learning exercise, students learn about the changes in Nebraska's population from 1880 to 2000 by studying a bar graph. Students answer 7 questions about the graph.
Curated OER
Metrically Me!
Students define the parts of a database, search strategies to locate information electronically, create/modify databases, etc. and enter data into a prepared spreadsheet to perform calculations.
Curated OER
Cold, Clouds, and Snowflakes
Students explore satellite data and graphing. In this weather data analysis math and science lesson, students analyze NASA satellite data to draw conclusions about geographical areas where precipitation might have happened. Students...
Curated OER
The Very Hungry Caterpillar
Read the story, The Very Hungry Caterpillar, and complete activities from multiple subjects. Make a mural, create a class graph, discuss the life cycle of a butterfly, research information about butterflies on the Internet and make...
Curated OER
Chances Are...
In this math worksheet, students perform 2 math investigations pertaining to probability--flipping pennies and rolling dice. Students record on the worksheet the results of each attempt, then graph the results. Note: The directions...
Curated OER
Mapping the Bone Field: An Area and Scale Exercise
Here is an excellent cross-curricular lesson. Learners relate multiplication to area by making a grid on graph paper, and then creating the same grid in real space outside in the school yard.
Curated OER
Does The Type of Mulch Used Affect Plant Growth?
Students measure, record and graph the plants they grow in a controlled setting. They feed and water the plants as needed and use the scientific method to evaluate the growth.
Curated OER
Multiplying With Nine As A Factor
Elementary math minds complete various activities to memorize the multiples of nine. They watch a PowerPoint presentation and demonstrate the finger trick. Unfortunately the link to the multiplication activities does not take you...
Curated OER
Number Pairs
As you introduce graphs to young scholars, use this coordinate pairs activity to give them some independent practice. Learners examine 12 points on a graph, all of which are in the first quadrant (and therefore positive). They write the...


