Curated OER
It's Your Choice
Students compare data and determine the appropriate way to organize the data. They use physical graphs, pictographs, and symbolic graphs to display their data. In addition, they complete a Venn diagram.
Curated OER
Virtual Field Trip
Students calculate gasoline cost per mile on a virtual field trip. They calculate the gasoline costs and travel time for each of the 2 routes, and record on a data sheet. They use Excel to create data tables for mileage, gasoline...
Curated OER
Checking County Numbers
Students use their county's information page to gather information about their community. Using the information, they create graphs from the tables provided and interpret the data. They write a paragraph showing their interpretation of...
Curated OER
Drip, Drip, Drip
Pupils gather scientific data and be able to utilize the data to generalize results over a long period of time. They use the appropriate tools to measure quanities of liquids and analyze the data to determine the cost of a leaky faucet.
Curated OER
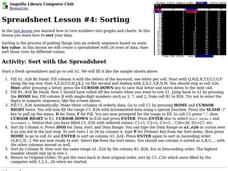
Sorting
Students examine how sorting is the process of putting things into an orderly sequence based on some key value. In this activity students create a spreadsheet with 26 rows of data, then sort those rows by different values.
Curated OER
Equivalent Fractions Manipulatives
Students study fractions. In this equivalent fractions instructional activity, students utilize fraction strips to enhance their understanding of equivalent fractions. They watch a demonstration and then work independently with their own...
Pennsylvania Department of Education
Volume and Surface Area
Build boxes using unit cubes to compare surface area and volume. The group performs multiple experiments to determine properties of volume, such as if it makes a difference which order the dimensions are multiplied in. Extensive...
Curated OER
Probability With a Random Drawing
Students define probability, and predict, record, and discuss outcomes from a random drawing, then identify most likely and least likely outcomes. They conduct a random drawing, record the data on a data chart, analyze the data, and...
Curated OER
That Was Then, This Is Now
Students examine the price of food over time. They analyze charts, perform math operations and compare and contrast data about the price of food. They complete worksheets while interperting the charts.
Curated OER
Comparison of Snow Cover on Different Continents
Students use the Live Access Server (LAS) to form maps and a numerical text file of snow cover for each continent on a particular date. They analyze the data for each map and corresponding text file to determine an estimate of snow cover...
Curated OER
Mathematical Magazines
Students classify and tabulate the type of advertisements found in a collection of magazines. Determination is made on what percent of the total number of ads each type represents. They present their results orally and in a graph.
Curated OER
Cool Times with Heat
Learners work with thermometers to complete problems about temperature. They investigate cooling patterns, how location affects temperature, and what happens when water having different temperature is mixed. They measure temperature in...
Curated OER
Not Everything is More Expensive
Learners explore percent increases and decreases. They calculate the percent increase and decrease. Students use math to solve problems and communicate. They apply the given formula for percent increase/decrease.
Curated OER
Learning About Graphics
Learners practice using and filling in a spreadsheet. They also create graphs and charts that coorespond with the data. This is a unit comprised of four lesson plans.
Curated OER
Fractions in Action
Investigate equivalent fractions with your class. They compare and order fractions. Then they work cooperatively in groups to experiment and problem solve with fractions using a game format. Multiple resources are provided.
Curated OER
Graph Both Crusts
Fourth graders calculate the angles and construct a pie graph of the percentages of the elements in the continental and oceanic crusts. Then they analyze the results. They can be assigned the task of researching the percentages.
Curated OER
Cloud Observation and Graphing
Students identify the three major cloud groups. They are introduced to the three main cloud types and spend a week making and recording observations of clouds. Students produce a graph that presents their findings and conduct research...
Curated OER
Watermelon Math
Students compute the mean and median of the number of seeds in a watermelon. They work in groups with a slice of water to complete and compare their calculations. They get a class average and mean.
Curated OER
Patterns Here, There, and Everywhere!
Upper graders access the Microsoft Word program and create patterns by utilizing certain keys on the keyboard. They create picket fences, smiley faces, and hearts. It seems that this lesson has as much to do with keyboarding skills as it...
Curated OER
Cover and Boarders
Young scholars find the area and perimeter of rectangular figures. They use this information to find patterns and discover relationships between area and perimeter. Students apply and explain formulas relating to perimeter, area, and...
Curated OER
Parts of a Whole
Fourth graders explore fractions through the analysis of various paintings. They view and discuss paintings by Picasso and Seurat, discuss the fractional examples in the paintings, and create a bar graph.
Curated OER
Ya' Gotta Have Heart
Fourth graders study the parts of the human circulatory system and how they function. They design a flow chart of the circulatory system and use data to construct charts and graphs.
Curated OER
Inventors Unit Survey
Students develop and conduct a survey for their inventors unit. They create a five question survey and tally the survey results, and create a graph using Microsoft Word and Graph Club 2.0.
Curated OER
One Square Foot
Students identify, describe, count, tally, and graph life found in one square foot of land.


