Alabama Learning Exchange
Scaling Down the Solar System
Learners work collaboratively to gain a better understanding of the vastness of space by scaling down the solar system. They measure by inches, gain an understanding of space, and model the distances of the planets from the sun.
Curated OER
Investigation 7 - Interpreting Weather Data
Fourth graders interpret the weather data they gathered in Investigation 6. They take an average of each component in each season. They compare the same components of each season and write the differences they see between the seasons.
Curated OER
Volcano Spreadsheet and Graph
Fourth graders find the height of selected volcanoes and convert their measurements to feet. Students interpret information from a graph. They also write math questions that require the use of a class created graph. Students use a...
Curated OER
Let's Graph It!
Students graph the height of others in centimeters and inches, find the slope of line in order to calculate the conversion factor between centimeters and inches.
Curated OER
Virtual Field Trip / Route, Mileage and Gasoline Cost Graphs
Students use a spreadsheet program to graph and compare milage, gasoline costs and travel time for two travel routes in their virtual field trip in Michigan. They determine the most economical route based on the graphs and calculations.
Curated OER
Pictograph Activity
In this pictograph worksheet, students learn to read a pictograph and answer questions based on the data. Students then draw two of their own pictographs using the given information and answer questions based on graphs.
Curated OER
Mapping the Ocean Floor
Students construct and interpret a line graph of ocean floor depth and a bar graph comparing the height/depth of several well-known natural and man-made objects and places. In addition, they calculate the depth of two points using sonar...
Curated OER
Download and Analyze
Students download information from a NASA website into a database. They transfer it to a spreadsheet by completing the information and analyze the information. They determine temperature averages, mode, and graph the results. They write...
Curated OER
A Day to Remember!
Students study math. In this real-life problem solving lesson, students work on their skills dealing with time and money. They work in small groups on various time and money word problems and by the final day they have a final problem...
Curated OER
Jelly Bean's Galore
Students investigate the origins of the Jelly Bean. They complete a Scavenger Hunt using the jellybean website. Pupils create a bar graph using information collected about jelly beans. Students discuss the time of year that Jelly Beans...
Curated OER
Tall Tale Rollers
Learners explore American tall tales. In this tall tale lesson, students discover the six characteristics that are included in tall tales. Learners survey their class to find each student's favorite tall tale character and organize the...
Curated OER
Histograms
For this histograms worksheet, students solve 5 word problems based on a histogram of presidential ages at their inauguration. Next, students create a frequency table and a histogram based on a list of data which shows the average...
Curated OER
Pumped Up Gas Prices
Students calculate gas prices. In this transportation lesson, students tally the mileage and gas costs of their car for one months. They figure out how much was spent on gas and create a graph showing average gas prices over time.
Curated OER
Living Room Redecoration
Fourth graders use math in a living room redecoration instructional activity. In this geometry instructional activity, 4th graders get the dimensions of a living room and need to find the amount and cost of paint and flooring. They read...
Curated OER
Shop 'Til You Drop
Students evaluate food prices. For this real world math lesson plan, students compare the cost of various grocery items to determine which is the best deal. They work in groups using grocery ads to decide how to get the most product for...
Curated OER
Misleading Graphs Lesson Plan
Students design and build water balloon catchers from random scrap materials, while taking into consideration a multitude of variables including: cost, maintenance, total capacity, etc.
Curated OER
Valentine Candy Count
Students investigate what color Valentine Candy is found more often than any other in a standard bag of "Valentine Conversation Hearts." They sort, classify and graph their findings.
Curated OER
Classroom Census (Analyzing Data)
Students create graphs. In this data analysis lesson, students fill out a student census and then use the data collected to produce graphs. Students write paragraphs interpreting the data.
Curated OER
Organizing And Reading Data
Students complete three parts of an "Organizning and Reading Data" worksheet. First, they go over the rubric to determine the work will be scored. They organize data by taking tallies, make a pictograph and a bar graph using the data....
Curated OER
Cold Enough?
Students read and record temperatures and display the data. They represent the temperatures on an appropriate graph and explain completely what was done and why it was done. Students display the data showing differences in the daily...
Curated OER
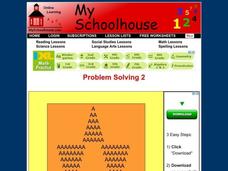
Problem Solving 1
In this online interactive problem solving worksheet, students examine a diagram and use their problem solving skills in order to respond to 5 questions.
Curated OER
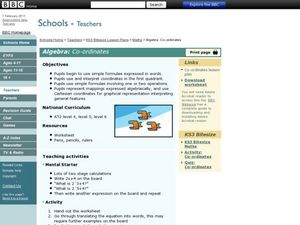
Algebra: Co-ordinates
Students use Cartesian coordinates. In this graphing lesson students use simple formulae, interpret coordinates, and create graphical representations. They express their work algebraically.
Curated OER
What's Your Favorite Planet?
Fourth graders interpret a graph and make correlations using data. After taking a class survey, 4th graders create a class graph of their favorite planets. Working in small groups, they interpret the information and create at least ten...
Curated OER
The Great Pollinators
Young scholars discover the reproductive parts of a plant. In this biology lesson, students identify and categorize several different plants they dissect in class. Young scholars record their information using a data chart.

