Curated OER
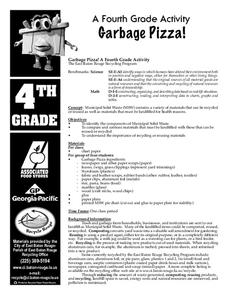
Garbage Pizza
Fourth graders explore the concept of waste management. In this recycling lesson, 4th graders identify materials that must be landfilled as well as items that may be recycled or reused.
Curated OER
Thanksgiving Web Quest
Students review the reasons why Thanksgiving is celebrated in the United States. Using the internet, they research the history of the holiday and discover what the first Thanksgiving was like. They also examine a typical menu for a...
Curated OER
The Seed and I
Pupils examine the patterns and structures of seeds and fruits. Using different types of organisms, they identify the similiarities and differences between them. They create their own seed design and shares it with the class.
Curated OER
Is It There?
Students participate in a lesson designed to illustrate these concepts using simple materials. They use Science process skills to observe, measure, predict, make inferences, and communicate while completing the activity. Proper safety...
Curated OER
Marshland Wonders
Students review the characteristics of wetlands and list their benefits. After viewing short videos, they identify the organims that make their home in wetlands and how they have adapted. They compare and contrast the characteristics...
Curated OER
Root, Root, Root for the Nutrients
Students observe the growth of a seed, predict what will happen when seeds are planted without soil, and conduct an experiment using a hydroponics system.
Curated OER
Traveling the USA
Pupils simulate the role of travel agents addressing the needs of a foreign family visiting a state in the US. They prepare a presentation and informational sales pitch of a proposed travel itinerary.
Curated OER
Reading Trees: Understanding Dendrochronology
Students examine tree-ring dating and discuss the lack of water the settlers in Jamestown faced. They create paper tree rings, simulate rain patterns, and describe the history of construction paper tree sequences.
Curated OER
Comparison of Snow Cover on Different Continents
Students use the Live Access Server (LAS) to form maps and a numerical text file of snow cover for each continent on a particular date. They analyze the data for each map and corresponding text file to determine an estimate of snow cover...
Curated OER
Circle the Earth - Explore Surface Types on a Journey around Earth
Students use CERES percent coverage surface data with a world map in locating landmasses and bodies of water at Earth's Equator.
Curated OER
Habitats: Rainforest
Students use the internet to find reasons the rainforest is endangered and ways that affects the rest of the world. They read for information, perform experiments, locate rainforests on maps, and write about this ecosystem.
Curated OER
VAcations in Northern California
Students explore the natural resources and National Parks of Northern California that are commonly visited by people traveling in the United States. They use maps to locate various sites, plan a highway travel route and use the internet...
Curated OER
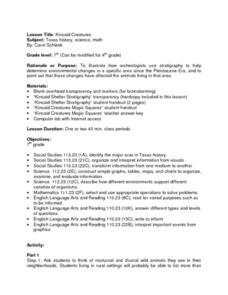
Kincaid Creatures
Students brainstorm a list of nocturnal and diurnal wild animals they see in their community and discuss how the animals would be different if they were living during the Ice Age. Using a handout, they discover how archeologists record...
The Math League
The Math League: Using Data and Statistics: Pie Charts
This introductory tutorial about statistical graphing with four examples of how pie charts (circle graphs) are constructed and read.
Primary Resources
Primary Resources: Line Graphs and Pie Charts
Here are a few resources to use with your students when teaching about line graphs or pie charts.
Scholastic
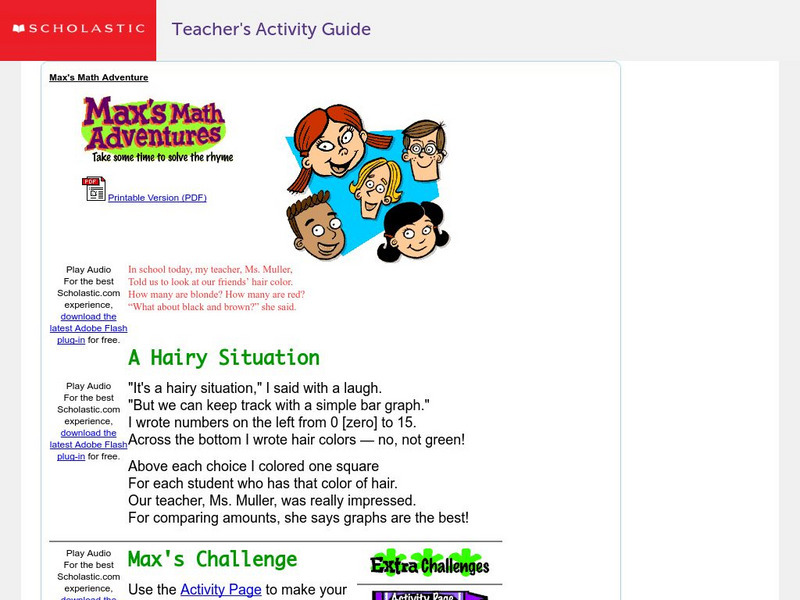
Scholastic: Max's Math Adventures: A Hairy Situation
Help Max make a bar graph to show the hair colors of his classmates. Teachers will appreciate the activities with bar graphs in the extra challenges. Use the teacher's guide to create a fun and engaging lesson.
Math Is Fun
Math Is Fun: Data Graphs
Create and customize a bar graph, line graph, or pie chart based on a set of data and print it out.
Math Is Fun
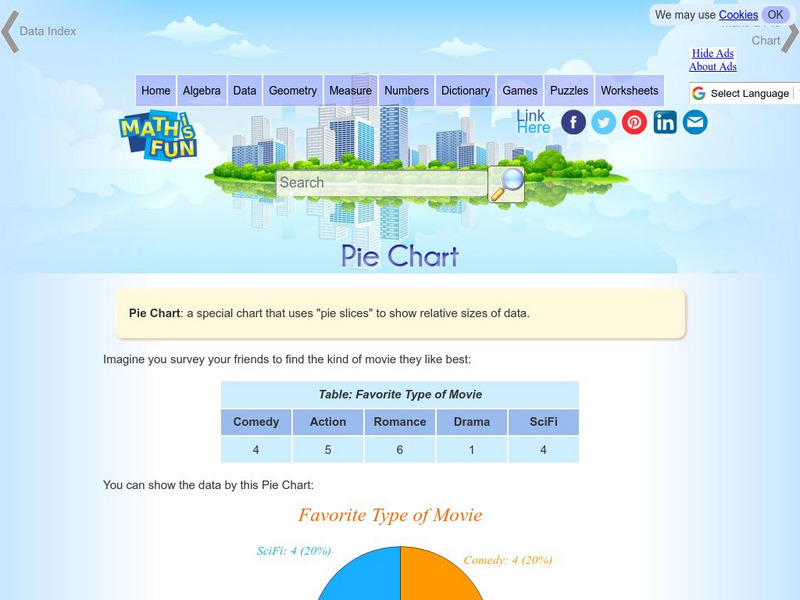
Math Is Fun: Pie Chart
Explains, with examples, what a pie chart is and how to make one. Includes a set of practice questions.
E-learning for Kids
E Learning for Kids: Math: Tea Store: Reading a Table
Students will demonstrate how to interpret information in a table.
The Math League
The Math League: Using Data and Statistics
This site contains two short examples of line graphs, charts that show change over time. This is a quick introduction to the topic of statistical graphing.
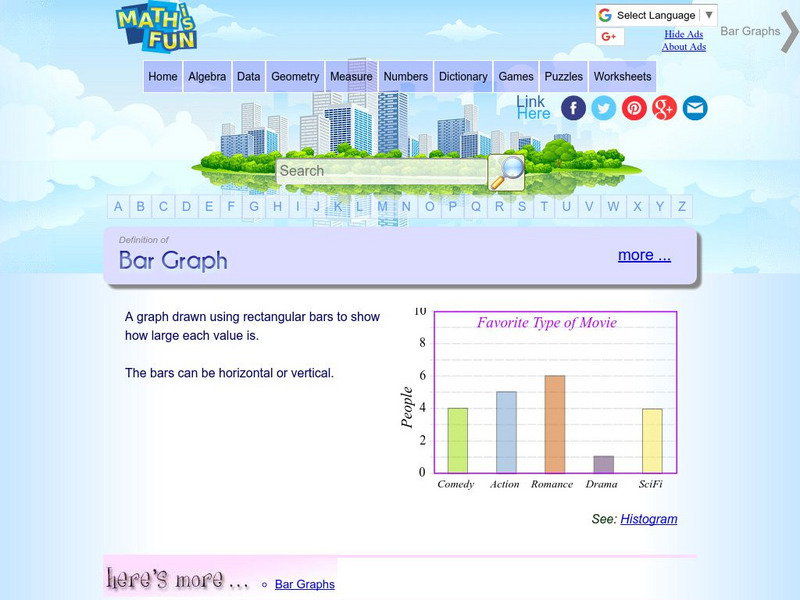
Math Is Fun
Math Is Fun: Definition of Bar Graph
Get the definition for a bar graph. Then, select the link "here's more" and use the interactive graph to display data as a bar graph, line graph or pie chart. The finished graph may be printed.
The Math League
The Math League: Ratio and Proportion
This tutorial provides definitions and examples of ratios and proportions and features comparing ratios and converting rates.
University of Cambridge
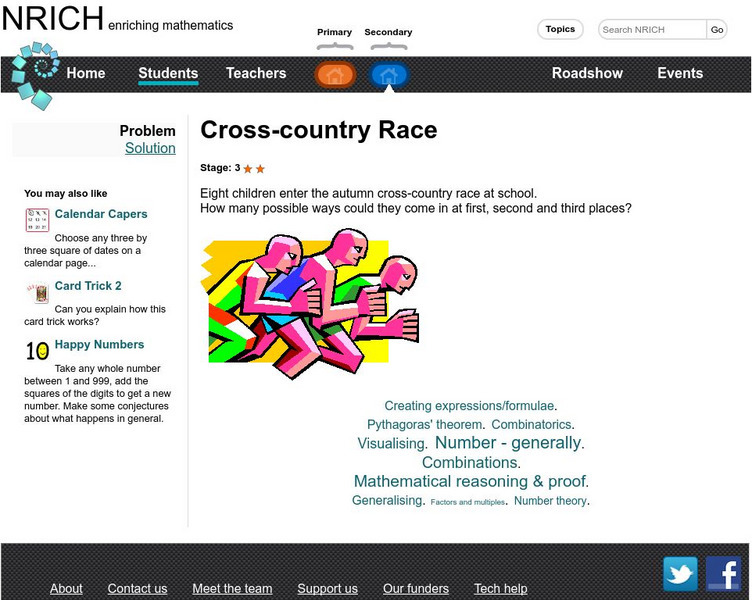
University of Cambridge: Nrich: Cross Country Race
On this one page website sharpen your logic and problem solving skills while working on this challenge. The solution is available to double check your solution.
Science Education Resource Center at Carleton College
Serc: Inquiry: How Herbs Change Based on Growing Conditions
In this activity, students will develop writing, math, and inquiry skills by investigating the taste of basil. Students will test basil in different growing conditions while also comparing it to a controlled variable. Students will then...
