Curated OER
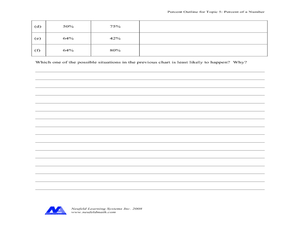
Percent of a Number
In this percent worksheet, students complete problems such as changing percents to decimals, filling in percentage charts, and more. Students complete 8 problems.
Curated OER
Cool Times with Heat
Learners work with thermometers to complete problems about temperature. They investigate cooling patterns, how location affects temperature, and what happens when water having different temperature is mixed. They measure temperature in...
Curated OER
Not Everything is More Expensive
Learners explore percent increases and decreases. They calculate the percent increase and decrease. Students use math to solve problems and communicate. They apply the given formula for percent increase/decrease.
Curated OER
Equal Parts
In this equal parts worksheet, students, working with a partner, study, formulate and calculate the answers to six word problems or drawings.
Curated OER
Graph Both Crusts
Fourth graders calculate the angles and construct a pie graph of the percentages of the elements in the continental and oceanic crusts. Then they analyze the results. They can be assigned the task of researching the percentages.
Curated OER
Simplifying Fractions
For this math worksheet, students create fractions to represent the pie graphs and then perform the operations to simplify the ratios.
Curated OER
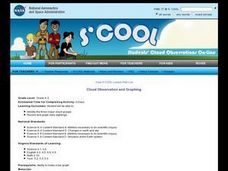
Cloud Observation and Graphing
Students identify the three major cloud groups. They are introduced to the three main cloud types and spend a week making and recording observations of clouds. Students produce a graph that presents their findings and conduct research...
Curated OER
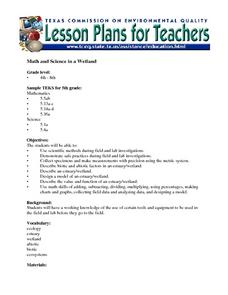
Math and Science in a Wetland
Students describe safe practice when doing field and lab investigations in a estuary or wetland. They create a model of an estuary and describe their value and function. They participate in field study in which they collect and analyze...
Curated OER
Getting There
Students practice reading a pictograph. In this data analysis lesson, students collect data and create their own pictograph. A students worksheet is included.
Curated OER
Watermelon Math
Students compute the mean and median of the number of seeds in a watermelon. They work in groups with a slice of water to complete and compare their calculations. They get a class average and mean.
Pennsylvania Department of Education
Volume and Surface Area
Build boxes using unit cubes to compare surface area and volume. The group performs multiple experiments to determine properties of volume, such as if it makes a difference which order the dimensions are multiplied in. Extensive...
Curated OER
Metrically Me!
Students define the parts of a database, search strategies to locate information electronically, create/modify databases, etc. and enter data into a prepared spreadsheet to perform calculations.
Curated OER
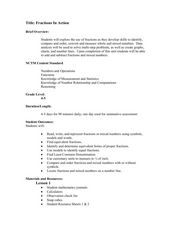
Fractions in Action
Investigate equivalent fractions with your class. They compare and order fractions. Then they work cooperatively in groups to experiment and problem solve with fractions using a game format. Multiple resources are provided.
Curated OER
Handling Data: Representing Date - Online Version
Here is an online lesson plan on data representation. In it, learners access websites embedded in the plan which lead them through a variety of activities around data representation and statistics. The activities are quite good, and...
Curated OER
An Apple A Day
Students create a graph that showcases their pick for favorite kind of apple. Students are given samples of a variety of apples to determine their favorite in a taste test. They a create a tally chart of favorite kinds apples and use a...
Curated OER
Ya' Gotta Have Heart
Fourth graders study the parts of the human circulatory system and how they function. They design a flow chart of the circulatory system and use data to construct charts and graphs.
Curated OER
Temperature
For this temperature worksheet, students color a thermometer to depict the given temperature. They then compare, contrast temperatures and answer given thinking questions. There are approximately 20 questions on this one-page...
Curated OER
Meter Reading Using Place Value
Fourth graders watch a video about reading a gas meter and discuss what they saw in the clip. For this place value lesson, 4th graders complete a worksheet where they fill in the missing dials on the meters.
Curated OER
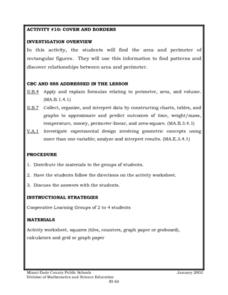
Cover and Boarders
Young scholars find the area and perimeter of rectangular figures. They use this information to find patterns and discover relationships between area and perimeter. Students apply and explain formulas relating to perimeter, area, and...
Curated OER
Count on Me
Fourth graders use inductive reasoning to find algebraic patterns in geometric figures. They use technology (i.e., calculators, computers) and manipulatives to discover number patterns involving geometric concepts. They solve concrete...
Curated OER
Parts of a Whole
Fourth graders explore fractions through the analysis of various paintings. They view and discuss paintings by Picasso and Seurat, discuss the fractional examples in the paintings, and create a bar graph.
Curated OER
The Great Turkey Walk
Young scholars formulate questions that can be addressed with data and collect, organize, and display relevant data to answer them. They wcreate bar graphs and pie graphs
Curated OER
It's Your Choice
Students compare data and determine the appropriate way to organize the data. They use physical graphs, pictographs, and symbolic graphs to display their data. In addition, they complete a Venn diagram.
