Curated OER
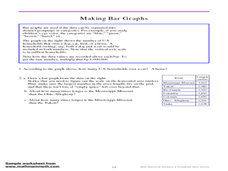
Making Bar Graphs
In this bar graph instructional activity, students answer short answer questions about bar graphs. Students answer 1 question about a bar graph about a cat, and 3 questions about a bar graph about U.S. rivers.
Curated OER
Charts and Graphs
In this charts and graphs worksheet, students refer to charts and graphs to solve word problems. Students complete 10 multiple choice word problems.
Curated OER
Graphing Using Cookies
Students differentiate between bar graphs, line graphs, pictographs and bar graphs. After participating in a hands-on cookie activity, students label and draw their own graphs.
Curated OER
Number lines and graphs
In this number lines and graphs instructional activity, students identify points on a number line and in a graph. Students complete 10 multiple choice questions.
Curated OER
Let's Graph It! Pre-Test
For this graphing worksheet, students complete a set of 10 multiple choice questions, clicking on a link to see correct answers or print the page.
Curated OER
Learning to Make Bar Graphs
Students construct bar graphs using the results from various experiments. In this graphing lesson, students review data from a previous experiment and demonstrate how to construct a bar graph. Students use a checklist to ensure...
Curated OER
Bar Graph Lesson
Students make a bar graph. In this graphing lesson, students discuss why bar graphs are used and are shown bar graph examples. Students create their own bar graph to compare the heights of different things around the world. Students...
Curated OER
Organizing Data Using Tables and Graphs
Students create graphs and tables, as well as interpret and make inferences from the data shown to determine when and where graphs and tables are most useful.
Curated OER
Favorite Candy Bar Graph
Students decide on six different types of candy bars to include in a data collection activity. Working in small groups, they survey a target group in a set amount of time. They access a Internet based graphing tool to create a bar graph...
Curated OER
Bar Graphs
In this bar graphs worksheet, students, working with a partner, explore how to read and analyze the five answers to one mathematical bar graph.
Curated OER
Making a Bar Graph
In this bar graph worksheet, students analyze a data table and bar graph depicting information about stickers collected. Students answer 5 questions about the data displayed.
Curated OER
Reading Line Graphs
In this line graphs learning exercise, 4th graders, after studying a line graph illustrating Emily's hiking record, answer 4 short answer questions relating to the line graph.
Curated OER
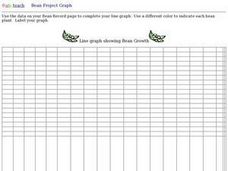
Bean Growth Project Graph Worksheet
In this bean growth project graphing worksheet, student collect data and create a line graph. They use a different color for each line that shows the growth of each bean plant.
Curated OER
Understanding Line Graphs
In this line graphs worksheet, 4th graders study a line graph with time and height and points A-D. Students answer four short answer questions relating to the line graph.
Curated OER
Using Circle Graphs
In this circle graphs instructional activity, students read a story about buying craft materials. Students examine the circle graph that shows how much spent on each type of material. Students then solve 3 problems using the data shown.
Curated OER
Charting and Graphing Sales
Students analyze and represent weekly sales figures using tables, bar graphs, and pie charts. They draw conclusions using bar graphs and pie charts. Students are told that each day at school they have the option of buying or bringing a...
Curated OER
Creating Graphs from Tables
Students interpret data from tables and then create a graph to show the same data in a different organization.
Curated OER
Immigration and American Life Graphing Immigration Data
Students practice graphing immigration data from the Caribbean. After practicing making their own graphs, they make the final graph and label it accordingly. They work together to determine the six most populated states of immigrants...
Curated OER
Graph Vocabulary
In this graph vocabulary interactive worksheet, students enter the appropriate graph words using the first letters as clues to the words. They look at a graph for clues and use verbs that are in the past simple. They complete 21 examples...
Curated OER
Misleading Graphs
Students explore number relationships by participating in a data collection activity. In this statistics lesson, students participate in a role-play activitiy in which they own a scrap material storefront that must replenish its...
Curated OER
Interpreting a Bar Chart
In this interpreting bar charts instructional activity, students examine a bar chart that shows how many people traveled on boats that took them out dolphin watching. They answer 8 questions about the times and number of people on the...
Curated OER
Favorite Sports Graph
In this data collection and graph worksheet, students ask each classmate which sport is their favorite based on the ones shown at the bottom of the graph. They color a square for each response, and tell the most and least popular sport.
Curated OER
Bar Graph- Calories In Fast Food Items
In this bar graph worksheet, students analyze a bar graph that shows calories in 10 fast food menu items. Students answer 7 questions about the graph.
Curated OER
Did You Eat That! - Food Graph
In this health and diet instructional activity, students ask ten of their friends what their favorite vegetables are. Then they tally their votes and shade them in on the graph provided.
Other popular searches
- Charts and Graphs Math
- Hidden Picture Math Graphs
- Misleading Graphs Math
- Powerpoint Math Graphs
- 1st Grade Math Graphs
- Math Graphs 4th Grade
- Math Reading Graphs
- Animals Math Graphs
- Math Graphs Grade 1
- Creating Math Graphs
- Math Graphs Using M&ms
- Math Interpreting Graphs


