Curated OER
Problem-Solving Strategy: Find a Pattern: Problem-Solving
In this finding patterns worksheet, students read the word problem about costume costs and study the graph. Students then follow the steps of understand, plan, solve, and look back to find the pattern.
Curated OER
Rewrite to Add: Homework
In this rewrite addends worksheet, students learn how to rewrite addends to add the given addition sentences. Students use the graph to help them rewrite the addends and then solve the five problems.
Curated OER
Hit or Miss
In this hit or miss worksheet, students play a game called hit or miss where they draw points on a graph and their partners have to guess where their points are. Students each get a grid and play a game representing battleship.
Curated OER
Hopes and Dreams: A Spreadsheet Lesson Using Excel
Fourth graders read "The Far Away Drawer" by Harriet Diller and discuss the story as a class. After discussion, 4th graders create a t-shirt GLYPH about their hopes and dreams,share their information with the class and create spreadsheets.
Curated OER
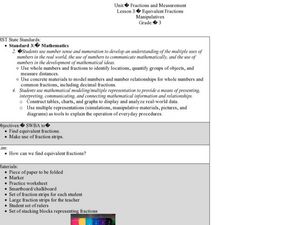
Equivalent Fractions Manipulatives
Students study fractions. In this equivalent fractions instructional activity, students utilize fraction strips to enhance their understanding of equivalent fractions. They watch a demonstration and then work independently with their own...
Curated OER
Color Survey
For this mathematical worksheet, learners survey twenty people to find out what their favorite color is and then graph out their findings.
Curated OER
Bungee M&M's
Science is exciting - and delicious! Pairs of learners set up a bungee cord type of experiment. They use buckets filled with M & M's, a meter stick, and a Slinky spring (as the bungee) to conduct their experiment. A good activity...
Curated OER
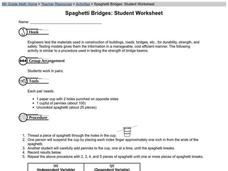
Spaghetti Bridges: Student Worksheet
Pairs of learners work together in order to simulate how engineers test materials for strength and safety in the real world. They use paper cups and pieces of spaghetti to run strength tests. This excellent worksheet should lead to...
Utah Education Network (UEN)
Insides and Outsides
Give small groups handfuls of unit cubes and then dare them to build as many rectangular prisms as possible using only 12 cubes. This engaging activity serves as an introduction to the volume of solid figures. In addition to volume,...
Curated OER
Be Sharp and Never Flat
An outstanding lesson on music awaits your young composers! They learn about patterns found in music, the different sections of an orchestra, and see the differences between musicians and a composer. Excellent streamed videos and good...
Curated OER
Basic Excel
Learners explore basic Excel spreadsheets. In this spreadsheet lesson plan, students enter Alaska weather information and perform calculations. Learners title the columns on the spreadsheet and format the cells. ...
Curated OER
You Are Here
Students map local places and learn to use scale and distance. In this mapping lesson, students map their school and a favorite place. Students recreate their maps showing distance and scale sizes. Students locate their...
National Security Agency
Growing Patterns: Practical Pattern Problems
Your learners explore growing patterns by describing, extending, creating, and evaluating practical pattern problems in this three-day collaborative unit. Beginning with concrete patterns and function tables to extend and...
Curated OER
Living in the Desert
Conduct an investigation on the plants used by the Hohokam tribe. To survive in the harsh desert environment the Hohokam used many natural resources. Learners read, research, map, and graph multiple aspects of Hohokam plant use as a...
Curated OER
A Closer look at Oil and Energy Consumption
Upper graders analyze basic concepts about the consumption, importation and exportation of the worlds oil production. They create several graphs to organize the data and draw conclusions about the overall use of oil in the world.
PLS 3rd Learning
Interpreting Heart Rates During Various Physical Activities
Learners review terminology: pulse, heart rate, target heart rate zone. They work in three groups, and assigned to one of three activity stations. At 5-minute intervals, 4th graders check their pulse and record it on their group...
Curated OER
Ball Bounce Experiment
Students investigate different balls' abilities to bounce. They conduct a Ball Bounce Height Comparison and Ball Bounce Time Comparison, complete a worksheet, graph the results of their experiment, and answer investigating questions.
Curated OER
How Does Your Blue Bonnet Grow?
Students explore the conditions needed to grow Texas Blue Bonnets. In this Blue Bonnet planting activity, students recognize the differences in Texas Blue Bonnet. Students record their findings in a graphs and analyze their results.
Curated OER
Tracking the Salt Front
Using the Hudson River as the focus, learners discuss the difference between salt water and fresh water environments, analyze maps and graphs, and complete addition and subtraction problems. This lesson comes with a wealth of...
Curated OER
Geo-Class Mapping My Neighborhood
Students create a map of the school and surrounding neighborhood. In this mapping lesson, students discover their school's location and learn about its past. Students use math skills and the steps in the design process to...
Baylor College
Lungometer
Life science learners construct lung-o-meters from gallon-sized milk jugs and then measure their lung capacities. For older learners, have them graph the vital lung capacities of each person in the class. Cross-curricular pieces are...
Curated OER
Bar Me In
Fourth graders watch a video about constructing bar graphs. They create their own graph and interpret it.
Curated OER
Survey Say...
Students examine a variety of charts and graphs that present data in a format that is easy to read. They work in groups to conduct a survey amongst their classmates. The data collected from the survey is then put on a bar graph.
Curated OER
Raising the Bar While Hogging the Ham (Radio That Is)
Students create a bar graph that communicates an amount without the need to know the exact data, determine what scale to use to best represent the data and use their bar graph to persuade others.
Other popular searches
- Charts and Graphs Math
- Hidden Picture Math Graphs
- Misleading Graphs Math
- Powerpoint Math Graphs
- 1st Grade Math Graphs
- Math Graphs 4th Grade
- Math Reading Graphs
- Animals Math Graphs
- Math Graphs Grade 1
- Creating Math Graphs
- Math Graphs Using M&ms
- Math Interpreting Graphs


