Curated OER
McCadam's Quarterly Report
Fourth graders problem solve a problem from a local business using data, generating graphs, and draw conclusions. They submit their findings in a business letter format with feed back from a company's plant manager.
Curated OER
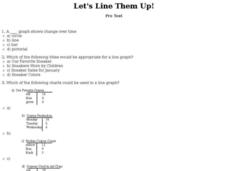
Let's Line Them Up!
In this line graph worksheet, students read through the problems about graphing and line graphs. Students select the best answer to solve the 10 online questions.
Curated OER
'The Flood'
Students hear the story "The Flood," and take a survey of the favorite pet animals in the class. They take the information complied in the survey and make a bar graph to show favorite pet animals using the computer program KidPix.
Curated OER
Opening the Case
Students participate in a class survey and then design an experiment and use graphs and statistics to assist them in solving a problem. They organize the results of the survey in a stem-and-leaf plot and find the range, median, mean, and...
Curated OER
Growing Up With A Mission
Student measure heights and graph them using growth charts for which they find the mean, mode, and median of the data set. They graph points on a Cartesian coordinate system.
Curated OER
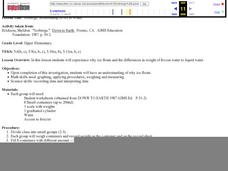
Icebergs: Relationship of Ice to Water
Young scholars experience why ice floats and the differences in weight of frozen water to liquid water. Students explore why ice floats. They use math skills such as: graphing, applying procedures, weighing and measuring. Young...
Curated OER
Manatee Awareness Survey
Students examine the public's awareness of manatees by taking a survey. They display the results of the survey as a graph.
Curated OER
Launch Time
Young scholars create and launch their own paper rockets. They complete graphs to show distances. They discuss what modifications could be made to make it go further.
Curated OER
Perfectly Square
Fourth graders use graph paper to make models of perfect squares. They be given a word problem in a worksheet imbedded in this plan. They may work in small groups or work alone to figure out the answer.
Curated OER
Map Making/Floor Plans/Map Reading
Students apply their knowledge of scale when mapping the classroom. They determine the use of a map legend and orient a map using a compass. They create the classroom maps using transfer graph paper.
Curated OER
How Much Will I Spend On Gas?
Students construct a linear graph. In this graphing lesson, students determine a monthly budget for gasoline. Students construct a t-chart and coordinate graph to display data. Resources are provided.
Curated OER
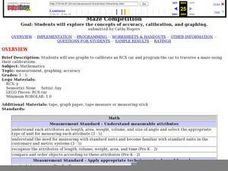
Car Maze competition
Learners use graphs to calibrate an RCX car. They must then program the car to traverse a maze using their calibrations
Curated OER
Mathematical Magazines
Students classify and tabulate the type of advertisements found in a collection of magazines. Determination is made on what percent of the total number of ads each type represents. They present their results orally and in a graph.
Curated OER
Probability
Fourth graders perform probability experiments. In this math lesson, 4th graders complete a penny toss to evaluate and graph the combinations of outcomes. In a second activity, students draw M&Ms out of a bag and graph results. In a...
Curated OER
Statistics: Misleading or Accurate?
Learners explore the concept of misleading statistics. In this misleading statistics lesson, students play a game of tag and graph the number of times each student gets tagged. Learners use the graph to determine the fastest runner in...
Curated OER
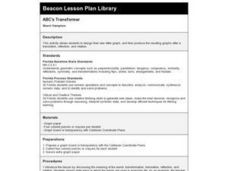
ABC's Transformer
Fourth graders design their own letter graph, and then produce the resulting graphs after a translation, reflection, and rotation. After a review of vocabulary, 4th graders create their graphs using crayons.
Curated OER
Describing Patterns
Fourth graders investigate repeating and growing patterns. Models, graphs and words are used to describe, extend and represent patterns. Students use evidence from models and graphs to support the identification of patterns.
Alabama Learning Exchange
Meteor or Meteorite
Students differentiate between a meteor and meteorite. They participate in an experiment to discover how the size and weight of an object determines the size of the impact crater. They utilize their math skills by measuring with a ruler...
Curated OER
Mobile vs. Money
Young scholars research the internet and use the information they find to plot straight line graphs. They use graphs to make comparisons of the various packages offered. Students interpret graphs and solve problems based on varying...
Curated OER
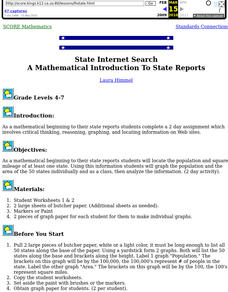
State Internet Search: A Mathematical Introduction To State Reports
Students locate the population and square mileage of at least one state. Using this information students graph the population and the area of the 50 states individually and as a class, then analyze the information.
Curated OER
Harry Potter Research Project
Students work together to complete a research project on Harry Potter. They write a research question and develop a survey to give to their classmates. Using the results, they create a graph and draw conclusions about the data collected.
Curated OER
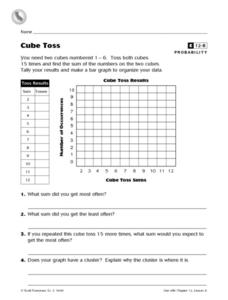
Cube Toss
In this probability and graphing worksheet, students solve 8 problems in which data from a cube toss is displayed on a table and graph. Students answer the questions about their results.
Curated OER
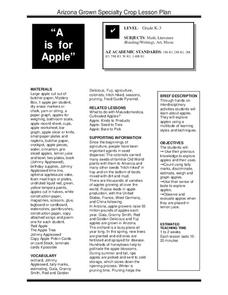
A is for Apple
Learners participate in a variety of activities to learn about apples. Students graph apples, learn about apple uses, taste apples, and observe what happens when apples are dipped in lemon juice.
Other popular searches
- Charts and Graphs Math
- Hidden Picture Math Graphs
- Misleading Graphs Math
- Powerpoint Math Graphs
- 1st Grade Math Graphs
- Math Graphs 4th Grade
- Math Reading Graphs
- Animals Math Graphs
- Math Graphs Grade 1
- Creating Math Graphs
- Math Graphs Using M&ms
- Math Interpreting Graphs

