Curated OER
Flavorful Spreadsheets
Learners create a spreadsheet which includes a bar graph. They sort and classify information and use the average function on a spreadsheet. They research Skittles candy and summarize their findings on a spreadsheet.
Curated OER
Telephone Time
In this telephone time worksheet, students study, discuss and compare two sets of data when represented on the same graph. Students set up an original graph.
Curated OER
Which is Your Favorite Dr. Seuss Book?
In this student survey worksheet, students gather information on classmates' favorite Dr. Seuss books. Students use a second worksheet to graph the results of their surveys.
Curated OER
Simplifying Fractions
For this math worksheet, students create fractions to represent the pie graphs and then perform the operations to simplify the ratios.
Curated OER
Fine Arts in School
In this math chart activity, students use the chart to answer the questions. The information on the chart is about students who participate in fine arts.
Curated OER
Data Chart
In this graphic organizer worksheet, students use this blank data chart for any math or language arts purpose. There are 2 vertical columns on the chart with spaces for headings at the top.
Curated OER
Boardwalk Fun
In this word problem learning exercise, students read about the preferences for each of the kids Colleen, Amy, Brian, and Jimmy. The kids all plan to visit a different place first. Students determine which place the kids will visit first...
Curated OER
Reading Challenge
In this math word problem worksheet, students use division to determine the page number Kelly was reading before she gave it to Andrew. Students also complete a challenge question and a graph for the reading challenge word problem.
Curated OER
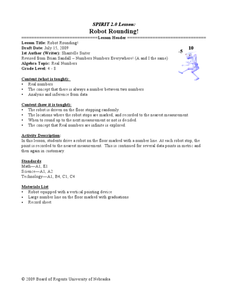
Robot Rounding!
Young scholars collect data on a robot and relate the behavior to prove there is an infinite minute set of numbers. In this algebra lesson, students verify that there is always a number between two numbers. They analyze and make...
Curated OER
Coordinates (3)
In this math worksheet, students explore coordinate graphing by analyzing a graph which has points plotted on both positive and negative sides. Students locate the points indicated and write the ordered pairs. There are no instructions...
Curated OER
Capture the Penguin
In this graphing activity, students play a game called Capture the Penguin where they put their penguins onto a graph with another player, roll dice to form ordered pairs, and start eliminating penguins. Students look at the scoring...
Curated OER
"Show Me" Missouri's Temperatures
Fourth graders gather climate data about cities from each of Missouri's five geographical regions and use technological tools to translate this data into graphs for further analysis and reflection.
Curated OER
Cool Times with Heat
Learners work with thermometers to complete problems about temperature. They investigate cooling patterns, how location affects temperature, and what happens when water having different temperature is mixed. They measure temperature in...
Curated OER
Practice with Experiment Conclusions
In this conclusions worksheet, students write one sentence to summarize the data given to them in a graph. Students complete 3 problems.
Curated OER
Grid Paper
In this math worksheet, students create a bar graph using a ten by ten grid paper. Students can also create shapes using the grid paper.
Curated OER
10 X 10 Grid
In this math worksheet, learners analyze a ten by ten grid. Students may use the grid for a variety of activities, including creating shapes or making graphs.
Curated OER
Garden Patterns
In this math worksheet, students find the values of the amount of plants that are growing in the garden based upon the dialogue.
Curated OER
Collect and Organize Data: Reteach
In this data collection worksheet, learners learn the parts of a tally chart and how it organizes information. Students then use the second tally chart to help them answer the six questions.
Curated OER
Mean, Median, Mode, and Range: Reteach
In this line plots learning exercise, students review how to make a line plot to show data and review the steps to find mean, median, mode, and range. Students then make a line plot for the data in exercise 1 and use it to answer the...
Curated OER
Make and use a Stem-and-Leaf Plot
In this stem-and-leaf plot worksheet, students use a given plot to solve 4 problems, then make a plot for given data and solve related problems. Houghton Mifflin text referenced.
Curated OER
Collect and Organize Data: Homework
In this collecting and organizing data worksheet, learners use the tally chart for the students' eye color to answer the first two questions. Learners then survey their family for eye color, record those results in a tally chart, and use...
Curated OER
Two Ways to Solve
In this data table worksheet, learners solve 4 word problems using the information on a data table about raffle tickets sold by 5 students.
Curated OER
Collect and Organize Data
In this data analysis worksheet, 4th graders use a tally chart about favorite television programs. They record which are least or most popular, rankings, and combinations of programs.
Curated OER
Find Probability
In this probability learning exercise, 4th graders answer 6 word problems using a tally chart that contains the results of rolling a dice that has the names of western states on it. They find the median, write fractions that show data,...
Other popular searches
- Charts and Graphs Math
- Hidden Picture Math Graphs
- Misleading Graphs Math
- Powerpoint Math Graphs
- 1st Grade Math Graphs
- Math Graphs 4th Grade
- Math Reading Graphs
- Animals Math Graphs
- Math Graphs Grade 1
- Creating Math Graphs
- Math Graphs Using M&ms
- Math Interpreting Graphs


