Curated OER
Thanksgiving Feast (Read the Charts)
Students practice reading charts about foods country of origin. They interpret information and answer questions related to charts. They discover how food production adds to the economy.
Curated OER
Apple Logic and Problem Solving
Learners examine apple production in the United States. For this interdisciplinary lesson, students use problem solving strategies introduced to solve math problems associated with apple production in the United States. Student collect...
Curated OER
Data and charts
In this data and charts worksheet, students answer multiple choice questions referring to different charts about mountain heights, breakfast drinks, and more. Students complete 10 multiple choice questions.
Curated OER
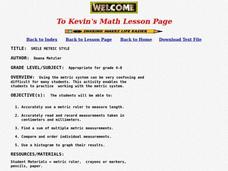
Smile Metric Style
Young scholars measure the length of student smiles and then record, order and graph their results.
Curated OER
Smile Metric Style
Students take measurements using a metric ruler, find a sum of multiple metric measurements, and use a histogram to graph their results.
Curated OER
Smile Metric Style
Students practice working with the metric system. Students use a metric ruler to measure and record lengths of group member's smiles, and graph their results. Students find the sum of all the smiles.
Curated OER
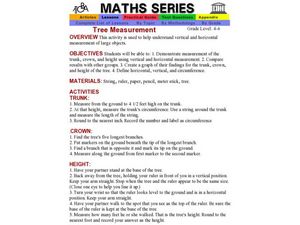
Tree Measurement
Students explore vertical and horizontal measurement of large objects. In pairs, they measure the trunk, crown, and height of a tree, create a graph of their results, and compare their results with their classmates.
Curated OER
Survey and Share
Students practice collecting data by surveying other students. In this data collection lesson plan, students decide on a question and collects data from 15 other students. Eventually the students will end up graphing their results.
Curated OER
Coordinate Grid Paper
In this coordinate grid worksheet, students are given a blank coordinate grid graph on which to plot points. Page is a blank template with no specific associated activities.
Curated OER
1st Geometry
In this geometry worksheet, students choose the multiple choice answer to 15 questions involving several different elements of geometry.
Curated OER
Handling Data: Representing Date - Online Version
Here is an online lesson plan on data representation. In it, learners access websites embedded in the plan which lead them through a variety of activities around data representation and statistics. The activities are quite good, and...
Curated OER
An Apple A Day
Students create a graph that showcases their pick for favorite kind of apple. Students are given samples of a variety of apples to determine their favorite in a taste test. They a create a tally chart of favorite kinds apples and use a...
Curated OER
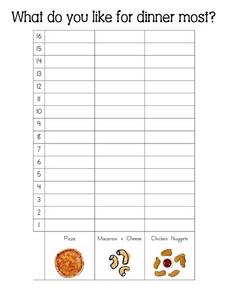
Dinner Survey
In this mathematical worksheet, students survey sixteen people to find out what they like for dinner most and then graph their findings.
Curated OER
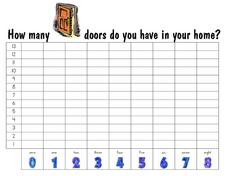
Home Survey
In this mathematical worksheet, learners survey thirteen people to find out how many doors they have in their home and then graph out their findings.
Curated OER
Measuring Things With Our Bodies
In this math worksheet, students graph out the estimated size of objects in comparison to the different parts of the human body.
Curated OER
Function Tables
In this graphing worksheet, students complete two different word problems by filling out the function tables and then writing an algebraic equation for the problems.
Curated OER
Problem Solving 1
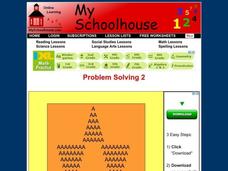
In this online interactive problem solving worksheet, students examine a diagram and use their problem solving skills in order to respond to 5 questions.
Curated OER
Make a Table
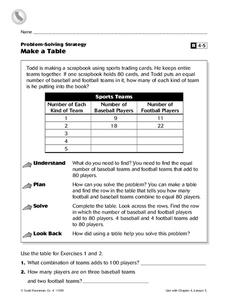
In this charting worksheet, 4th graders complete a table. Using the information provided, students fill in the missing data and complete 2 short answer questions.
Curated OER
Temperature
For this temperature worksheet, students color a thermometer to depict the given temperature. They then compare, contrast temperatures and answer given thinking questions. There are approximately 20 questions on this one-page...
Fuel the Brain
Interpret Pictographs
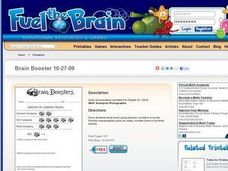
Have your youngsters use a graphic organizer and key to solve the following questions. By learning to interpret the pictographs, they will solve the problems accurately.
Curated OER
Handling Data/Measures of Average - Finding the Mean from Displayed Data
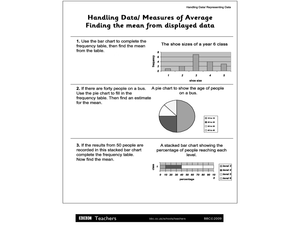
In this mean and average worksheet, students use the bars and charts to help them find the means using the given data. Students solve 3 problems.
Curated OER
Area
Students examine the mathematical concept of area. These activities and discussions may be used to develop students' understanding of this mathematical concept and will enable students to calculate the area of a random shape on a grid.
Curated OER
Stem and Leaf Plots
In this measures of central tendency worksheet, learners study a stem and leaf plot pertaining to weekly low temperatures. Students use the plot to answer 6 questions. There will be a question that requires learners to make their own...
Curated OER
Data Analysis
In these data analysis worksheets, learners complete 4 worksheets of activities for analyzing data. Students use the mean, median, mode, and range to organize the data.
Other popular searches
- Charts and Graphs Math
- Hidden Picture Math Graphs
- Misleading Graphs Math
- Powerpoint Math Graphs
- 1st Grade Math Graphs
- Math Graphs 4th Grade
- Math Reading Graphs
- Animals Math Graphs
- Math Graphs Grade 1
- Creating Math Graphs
- Math Graphs Using M&ms
- Math Interpreting Graphs


