Curated OER
Bar Graph Lesson
Students make a bar graph. In this graphing lesson, students discuss why bar graphs are used and are shown bar graph examples. Students create their own bar graph to compare the heights of different things around the world. Students...
Curated OER
My Test Book: Reading Graphs
In this online interactive math skills worksheet, students solve 10 multiple choice math problems that require them to read and interpret graphs. Students may view the correct answers.
Curated OER
Bar Graphs
In this bar graph worksheet, learners complete math problems having to do with different bar graphs. Students complete 10 problems for 10 different graphs.
Curated OER
Charts and Graphs
In this charts and graphs worksheet, students refer to charts and graphs to solve word problems. Students complete 10 multiple choice word problems.
Curated OER
Graphs and money
In this graphs and money worksheet, students complete word problems about different kinds of graphs and money in those graphs. Students complete 10 multiple choice problems.
Curated OER
Number lines and graphs
In this number lines and graphs instructional activity, students identify points on a number line and in a graph. Students complete 10 multiple choice questions.
Curated OER
Organizing Data Using Tables and Graphs
Students create graphs and tables, as well as interpret and make inferences from the data shown to determine when and where graphs and tables are most useful.
Curated OER
Chances Are
Upper graders examine the concept of probability. They collect data and create a bar graph. They must interpret the data as well. Everyone engages in hands-on games and activities which lead them to predict possible outcomes for a...
Curated OER
Are You My Little Peanut?
Fourth graders explore the mass and length of peanuts by pretending to parent a peanut. In this mode, median and range lesson students graph their measurements and then use them to find the mode, median and range. Students discuss peanut...
Curated OER
Scaling it Down: Caves Have Maps, Too
Measurement and map skills are the focus of this lesson, where students crawl through a "cave" made out of boxes, desks and chairs, observing the dimensions. Your young geographers measure various aspects of the cave and practice...
Curated OER
Introducing Multiplication
Learners will look at repeating addition examples and view how they can be written as multiplication. They use manipulatives to complete a repeating addition lesson and show it on graph paper. They also chart what they have found and...
Curated OER
Winter-time Temps
Students measure temperature and become aware the the temperature above and below the snow is different. In this winter temperature lesson, students measure temperatures to find variation based on how the snow is packed. Students...
Curated OER
The Square Counting Shortcut
An excellent lesson that encourages students to discover how complex figures can be broken into simpler shapes when measuring area. Working with block letters, learners are given the freedom to develop their own strategies for...
Curated OER
Coordinate Planes
Identifying the location of ordered pairs on coordinate planes is the focus in the math lesson presented here. In it, 4th graders are introduced to coordinate pairs, the x/y axis, and the techniques associated with this type of graphing....
Curated OER
Number Pairs
As you introduce graphs to young scholars, use this coordinate pairs activity to give them some independent practice. Learners examine 12 points on a graph, all of which are in the first quadrant (and therefore positive). They write the...
Curated OER
What's Your Favorite Planet?
Fourth graders, after listing the nine planets and their differences, choose one planet as their favorite. From the information acquired on each students favorite planet, they make a graph illustrating their favorites and then transform...
Curated OER
Chances Are...
In this math worksheet, students perform 2 math investigations pertaining to probability--flipping pennies and rolling dice. Students record on the worksheet the results of each attempt, then graph the results. Note: The directions...
Curated OER
Does The Type of Mulch Used Affect Plant Growth?
Students measure, record and graph the plants they grow in a controlled setting. They feed and water the plants as needed and use the scientific method to evaluate the growth.
Curated OER
Tally Charts and Graphs
Fourth graders play the game 'Data Picking', where they collect data, place the data into a tally chart, and choose the circle graph that best represents the data. They go to the Mathfrog website and select 'Picking'. Students choose...
Curated OER
Graphing Aquatic Insects
Students identify aquatic insects. In this organism instructional activity, students locate aquatic insects near a local waterway and collect them. Students graph the amount of insects that they collected.
Curated OER
Fourth Grade Math Practice-Statistics
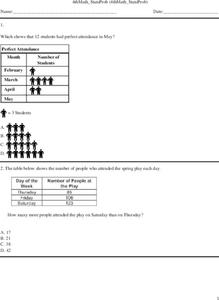
In this 4th grade statistics worksheet, students complete a total of 7 problems. An answer key is provided; problems are related to statistics.
Curated OER
Raising the Bar While Hogging the Ham (Radio, That Is)
Young scholars watch a Cyberchase video to determine the importance of using the correct scale when making bar graphs. They examine how to use bar graphs to gain information easily. They determine how to use bar graphs persuasively.
Curated OER
Garden Grid
Basically, your class reads about different garden plants from an included handout and seed packets that you provide, and then uses a grid to plan out where to place the plants. They can practice counting with the seeds, grouping,...
Curated OER
Getting A Grip On Graphs
Fourth graders investigate the concept of graphing and comparing different types of data using pictographs, line graphs, scatter plots, etc... They gather data and make interpretations while examining the medium of how it is displayed.


