Curated OER
Newport Weather Project
Students study weather and climate patterns using computer and Internet resources. They collect temperature information and share it with other classes via e-mail using graphs
Curated OER
Coordinate Geometry
Grab your class and get them graphing polygons on a coordinate plane! They investigate the four quadrants, discover the x and y axis, and correctly plot ordered pairs. To show their comprehension, each child creates a coordinate picture...
Curated OER
Factors
Practice factoring numbers by using graph paper, manipulatives and computer applets.
Curated OER
The Nifty Fifty-What's Your Size?
Students explore state populations. In this state geography lesson, students use a variety of technology tools to research and graph population and area of assigned states.
Curated OER
"who Lives in Your House?"
Fourth graders collect data about the people and animals living in their homes, and the students' shoe sizes. They work in groups to enter the information into a database from which they create graphs. They analyze the data to find the...
Curated OER
Where in the World Do Those Cookies Come From?
Students discuss exports and imports by discovering where the ingredients come from for making chocolate chip cookies. They take a survey of their favorite cookies and create a bar graph to represent the information.
Curated OER
Introduce Double-Digit Addition
Students generate a list of numbers then classify them into groups of single digit and double-digit numbers. After listening to a children's book about double-digit addition, they work with tens and ones blocks to solve double-digit...
Curated OER
The Statistics of M&Ms
Students explore the topic of statistics with M and Ms. For this math lesson plan, students use candy pieces to sort and gather information needed to create a bar graph. This lesson can be adapted to accommodate students in grades 1-12.
Curated OER
Bell Curve
Students explain normal distribution of a measurable characteristic within a group of objects. They create two graphs (one for each type of Hershey's Kiss) with increments of measurement on the X-axes and number of measurements on the...
Curated OER
Valentine Candy Count
Students analyze a bag of Valentine candy to create a graph. In this graphing lesson, students make predictions, sort by color, record data and make a graph. Students discuss results and make generalizations. Students generate their own...
Curated OER
Tally Time
Students create a tally chart. In this math and health lesson, students discuss healthy foods and create a tally chart showing the number of students who like to eat healthy foods.
Curated OER
Circles Minilab
Students learn how to measure the diameter and circumference of a circle. In this circle activity, students organize their data to create a graph. Students utilize their graph to make an inference about the slope of pi.
Curated OER
M&M Math
Learners sort a bag of M&M candies according to color using a sorting mat. They count M&M candies. They compare the number to their prediction then students create tally charts.
Curated OER
Tracking Olympic Gold!
Learners use print or online resources to track the results of the Olympic Games, record daily results on graphs, use graphs to collect information.
Curated OER
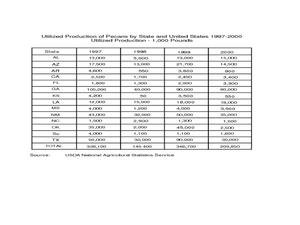
Pecan Power
Students study the origins of pecans and complete a bar graph from the data they have discovered. For this pecan lesson plan, students draw pecans, discuss a pecan time line, and draw a bar graph comparing Arizona pecans to other...
Curated OER
My Test Book: Stem and Leaf Plots
For this math skills worksheet, students solve 10 multiple choice math problems regarding stem and leaf plots. Students may view the correct answers.
Curated OER
Survey Says...
Students practice taking surveys to answer different questions about radio. In this communications lesson, students brainstorm to create questions they can ask strangers about how often they listen to their radio. Students...
Curated OER
Six Squares
Students create different shapes on grid paper. For this two-dimensional geometry lesson, students take turns outlining a shape made of six squares on the graph paper. They identify all shapes they see once everyone has had a...
Curated OER
My Test Book: Stem and Leaf Plots
In this math skills learning exercise, students solve 10 multiple choice math problems which require they interpret a stem and leaf plot. Students may view the correct answers.
Curated OER
The Lake Effect
Fourth graders conduct an experiment demonstrating the effects of water and air temperature on precipitation. They create graphs demonstrating their findings using Claris Works for Kids.
Curated OER
Melissa's Garden
In this math activity, students identify the location of pictures on a coordinate plane. They write some answers as an ordered pair. They read ordered pairs and identify the picture at a specified location. Six problems are on a page. An...
Curated OER
Turning the Tables: A Guide to Devising Your Own Story
Students observe and demonstrate how to decipher and organize the information in a math word problem and apply mathematical concepts to different story problems. They discuss the parts of a story problem, and write their own original...
Curated OER
My Test Book: Tally Charts
For this online interactive math worksheet, students solve 10 problems that require them to read and interpret tally chart data. Students may submit their answers to be scored.
Curated OER
On the Road Again
Students work with patterns to develop formulas that will help them determine total cost. In this patterning activity, students watch a video about an NBA trainer. (not included) They work in groups to access the assigned Internet...


