Curated OER
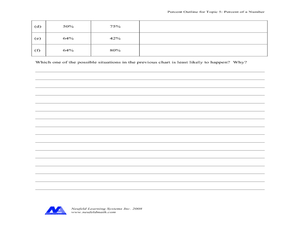
Percent of a Number
In this percent worksheet, students complete problems such as changing percents to decimals, filling in percentage charts, and more. Students complete 8 problems.
Curated OER
Pi Day (March 14)
Fourth graders determine the value of ? by measuring the circumference and diameter of circular objects such as soup cans, Oreo cookies, etc..
Curated OER
Buddy, Are You Ready?-Preparing for School Emergencies
Students explore natural disasters by reading stories about volcanoes, earthquakes, floods, and hurricanes. They explore safe behaviors in order to understand what to expect in a catastrophe. Students practice safe evacuation procedures...
Curated OER
Russian Dolls Investigation
Students measure a set of Russian dolls using the metric system. In this measurement lesson plan, students identify certain relationships between sets of measurements by measuring a set of Russian dolls and presenting their findings to...
Curated OER
Exploring Area/Perimeter Through Coordinate Geometry
Students explore area and perimeter through coordinate geometry using student literature, hands-on manipulatives, and the Internet.
Curated OER
High and Low Tides
Students collect real world data from the Web regarding high and low tides at various locations in the United States. They find a function which models this data and make predictions on tide levels based on the information found.
Curated OER
Multiple Intelligences Survey
In this multiple intelligences worksheet, students complete a survey asking them about different ways they like to learn. Students complete 24 questions. This should be a very enjoyable activity for students.
The Math League
The Math League: Using Data and Statistics: Pie Charts
This introductory tutorial about statistical graphing with four examples of how pie charts (circle graphs) are constructed and read.
Primary Resources
Primary Resources: Line Graphs and Pie Charts
Here are a few resources to use with your students when teaching about line graphs or pie charts.


