Curated OER
Root, Root, Root for the Nutrients
Students observe the growth of a seed, predict what will happen when seeds are planted without soil, and conduct an experiment using a hydroponics system.
Curated OER
Pi Day (March 14)
Fourth graders determine the value of ? by measuring the circumference and diameter of circular objects such as soup cans, Oreo cookies, etc..
Curated OER
Story Problem Writing
Students write story problems which can only be solved with the application of multiplication facts. They write an extra fact that isn't needed to solve. When their partners do the problems, they must cross out the fact that they do need.
Curated OER
Bats: Fact and Fiction
Students describe the characteristics and behaviors of bats. After viewing a video, they explain how bats use echolocation to navigate and how they find their young within a group. They list four misconceptions about the animal and...
Curated OER
Invasion of the Germs: We Fight Back!
Students fight off germs. In this technology skills lesson, students create claymation videos with accompanying podcasts that educate others about the H1N1 virus and methods to fight germs.
Curated OER
Circle the Earth - Explore Surface Types on a Journey around Earth
Students use CERES percent coverage surface data with a world map in locating landmasses and bodies of water at Earth's Equator.
Curated OER
Peekikng At Public Sculpture
Young scholars use the internet to investigate public examples of sculpture. They reflect upon the possibility of being a reference of lifestyles that can exist in a society. A variety of media sources serve as inspiration for the lesson.
Curated OER
Kincaid Creatures
Students brainstorm a list of nocturnal and diurnal wild animals they see in their community and discuss how the animals would be different if they were living during the Ice Age. Using a handout, they discover how archeologists record...
Curated OER
SC Populations Along Major Interstates
Students examine the population among the interstates in South Carolina. Using the internet, they identify the counties and roads and compare it with their own drawing.
Curated OER
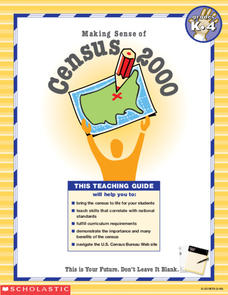
Making Sense of the Census
In this unit of lessons, students make sense of the Census. They examine why a census is taken and participate in activities.
Khan Academy
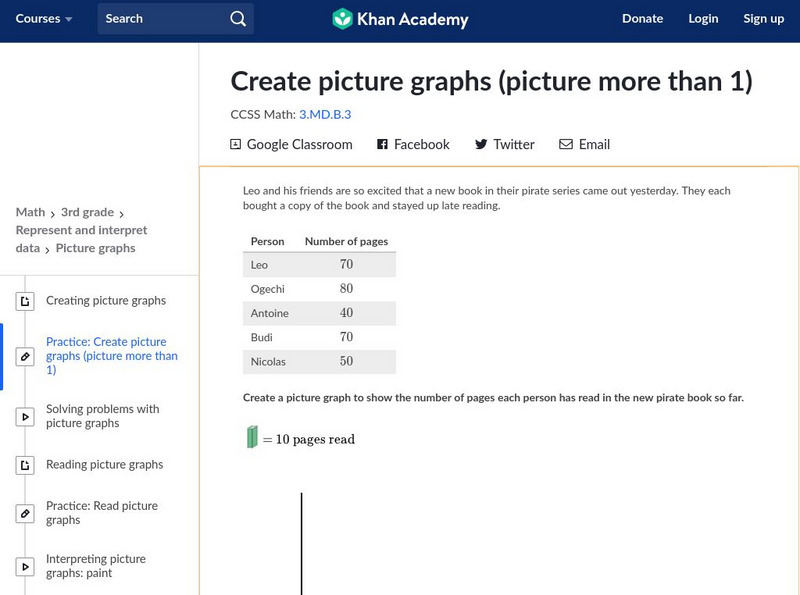
Khan Academy: Create Picture Graphs (Picture More Than 1)
Create and interpret picture graphs. Students receive immediate feedback and have the opportunity to try questions repeatedly, watch a video tutorial, or receive hints about how to create picture graphs. CCSS.Math.Content.3.MD.B.3 Draw a...
Khan Academy
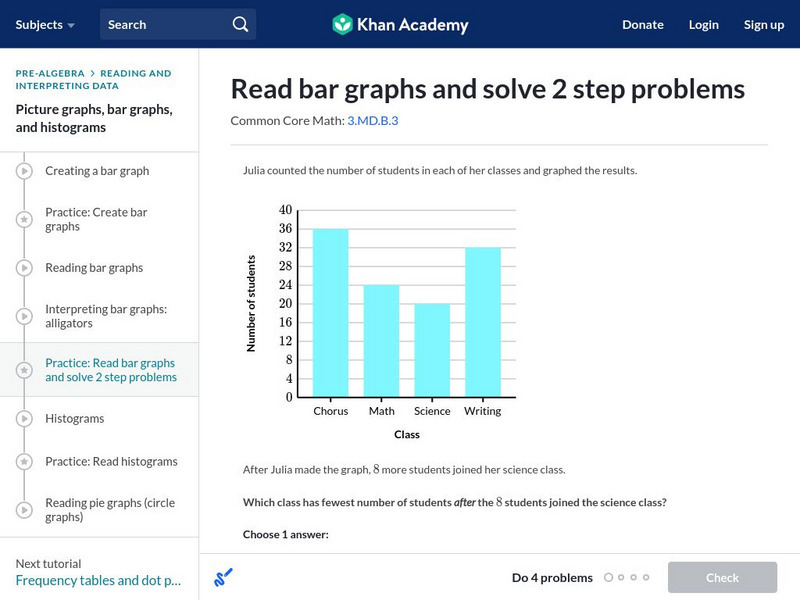
Khan Academy: Read Bar Graphs and Solve 2 Step Problems
Read and interpret a double bar graphs. Students receive immediate feedback and have the opportunity to try questions repeatedly, watch a video or receive hints. CCSS.Math.Content.3.MD.B.3 Draw a scaled picture graph and a scaled bar...
Primary Resources
Primary Resources: Tally and Bar Charts
Lots of good materials for teaching about tally marks and bar graphs.
Khan Academy
Khan Academy: Read Picture Graphs (Multi Step Problems)
Interpret picture graphs to answer questions about a context. Students receive immediate feedback and have the opportunity to try questions repeatedly, watch a video or receive hints.
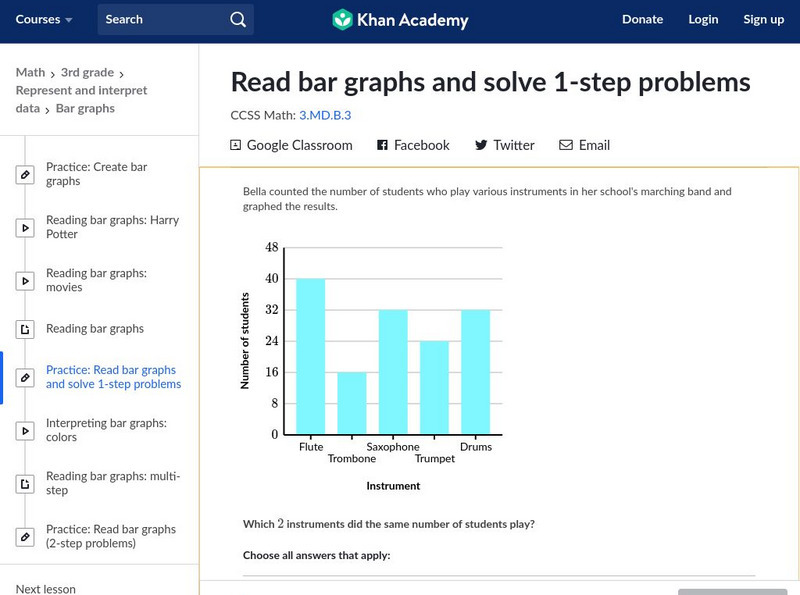
Khan Academy
Khan Academy: Read Bar Graphs and Solve 1 Step Problems
Interpret bar graphs to answer questions about a context. Students receive immediate feedback and have the opportunity to try questions repeatedly, watch a video or receive hints.
E-learning for Kids
E Learning for Kids: Math: Tea Store: Reading a Table
Students will demonstrate how to interpret information in a table.
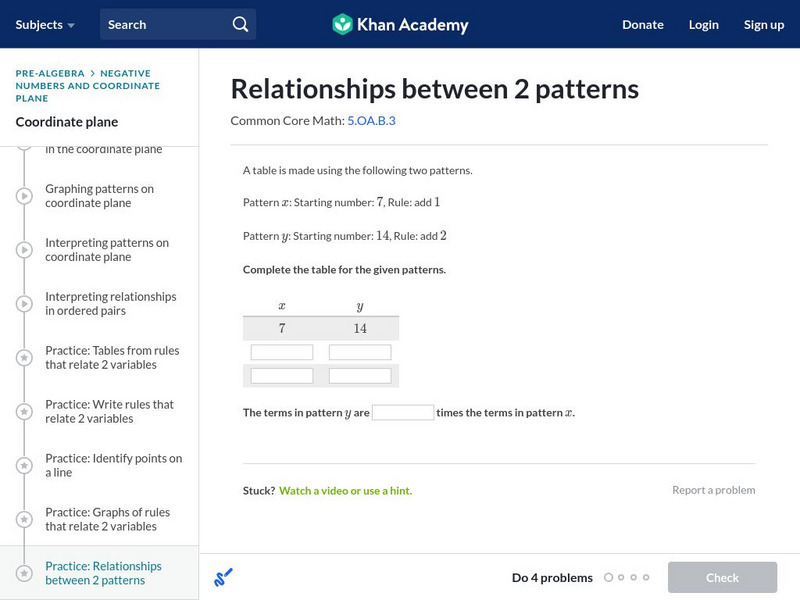
Khan Academy
Khan Academy: Interpret Relationships Between Patterns
Generate patterns using given rules. Identify relationships between terms. Graph ordered pairs consisting of corresponding terms from the patterns. Students receive immediate feedback and have the opportunity to try questions repeatedly,...
E-learning for Kids
E Learning for Kids: Math: Tea Store: Data and Graphs
Play games by exploring how to interpret bar graphs and organize data in a table.
University of Cambridge
University of Cambridge: Nrich: The Pet Graph
On this one-page website, sharpen your logic and graph reading skills by figuring out which pet goes with each bar on the graph. The solution is available to double check your own solution.
Math Is Fun
Math Is Fun: Histograms
Explains, with examples, what a histogram is, how it differs from a bar graph, and how to interpret one. Includes a set of practice questions.
Alabama Learning Exchange
Alex: We're in a Pickle
A hands-on lesson in which children work together to discover adjectives, write a descriptive paragraph, and apply math principles to produce a bar graph interpreting results from the lesson.
Fun Brain
Funbrain: What's the Point?
Challenge your graph-reading skills. Levels of difficulty are available.
That Quiz
That Quiz
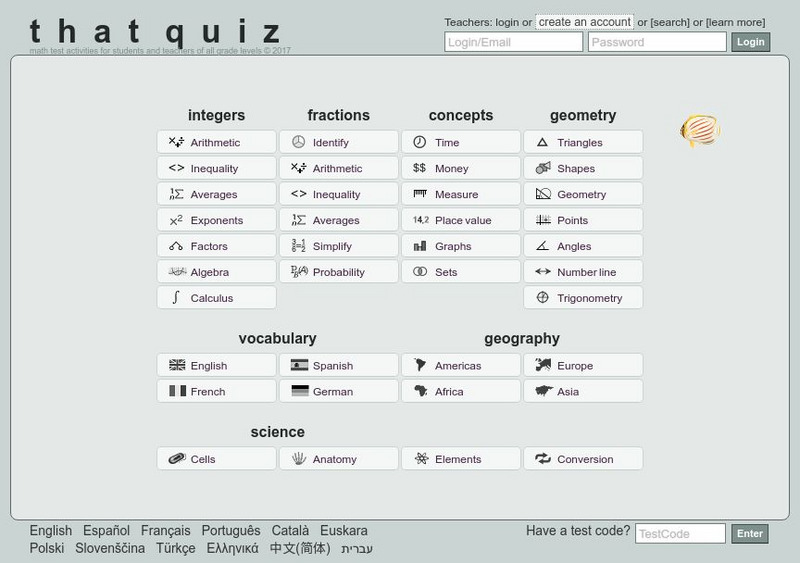
ThatQuiz is an excellent assessment tool for teachers and students. At this site, teachers can create individualized or group assessments on a variety of math topics. Students take these practice assessments directly online and receive...
BBC
Bbc: Representing Data
This BBC Math Bite tutorial for line graphs, pictograms, and frequency polygons features an exam in which students draw and interpret statistical diagrams.

