Curated OER
Cool Times with Heat
Learners work with thermometers to complete problems about temperature. They investigate cooling patterns, how location affects temperature, and what happens when water having different temperature is mixed. They measure temperature in...
Curated OER
Not Everything is More Expensive
Learners explore percent increases and decreases. They calculate the percent increase and decrease. Students use math to solve problems and communicate. They apply the given formula for percent increase/decrease.
Curated OER
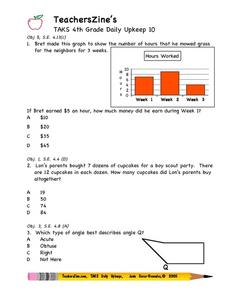
TAKS 4th Grade Daily Upkeep 10
In this math worksheet, 4th graders look for the answers to basic review problems that focus upon the skills of reading simple word problems, and applying the interpretation of data.
Curated OER
Fine Arts in School
In this math chart activity, students use the chart to answer the questions. The information on the chart is about students who participate in fine arts.
Curated OER
Draw an Inch, Walk a Mile
Students work in small groups to solve the problems presented. The main project, mapping the classroom, use these discussions to collaborate in creating a tangible demonstration of their understanding.
Curated OER
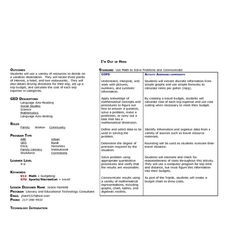
I'm Out of Here
Learners create a travel budget. In this budget activity, students research vacation destinations. Working independently, learners research destinations on the Internet and construct a budget for the vacation. Resources provided.
Curated OER
Handling Data: Representing Date - Online Version
Here is an online lesson plan on data representation. In it, learners access websites embedded in the plan which lead them through a variety of activities around data representation and statistics. The activities are quite good, and...
Curated OER
An Apple A Day
Students create a graph that showcases their pick for favorite kind of apple. Students are given samples of a variety of apples to determine their favorite in a taste test. They a create a tally chart of favorite kinds apples and use a...
Curated OER
Out of Sight, Out of Mind
Pupils analyze and graph the waste created in a typical lunch period. They increase awareness of various types of garbage students create during a lunch period. They construct and label a graph of lunch waste. They brainstorm...
Pennsylvania Department of Education
The Multiplicative Identity and Numbers Close to One
Pupils practice multiplying and dividing whole numbers by fractions. They study the multiplicative identity property that states that the product of any number and 1 is that number. They multiply whole numbers by fractions close to 1 and...
Curated OER
Introduce Double-Digit Addition
Students generate a list of numbers then classify them into groups of single digit and double-digit numbers. After listening to a children's book about double-digit addition, they work with tens and ones blocks to solve double-digit...
Curated OER
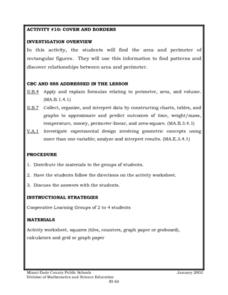
Cover and Boarders
Young scholars find the area and perimeter of rectangular figures. They use this information to find patterns and discover relationships between area and perimeter. Students apply and explain formulas relating to perimeter, area, and...
Curated OER
The Bigger they Are . . .
Pupils do a variety of data analyses of real-life basketball statistics from the NBA. They chart and graph rebounding, scoring, shot blocking and steals data which are gathered from the newspaper sports section.
Curated OER
Checking County Numbers
Students use their county's information page to gather information about their community. Using the information, they create graphs from the tables provided and interpret the data. They write a paragraph showing their interpretation of...
Curated OER
Measuring the Speed of a Wave
Students create an experiment in which they measure the speed of a wave and record the data in a graph. They work in small groups to write the procedure for the experiment and share it with another group for cross checking of the...
Curated OER
The Cost of Life
Students research the salary for a career of interest. They consider what kind of lifestyle that career would provide and graph their information for comparison.
Curated OER
Do You Have a Coin Collection?
Learners create a graph showing which young scholars in the class collect coins.
Curated OER
Extraordinary Compilations
Students discuss and record why people have various types of collections. They interpret the class collection of information then use details about the Morgan Dollar to understand what collection characteristics it may have.
Curated OER
Confusing Colors!
Fourth graders collect data, graph their data, and then make predictions based upon their findings. They's interest is maintained by the interesting way the data is collected. The data collection experiment is from the psychology work of...
Curated OER
One Square Foot
Students identify, describe, count, tally, and graph life found in one square foot of land.
Curated OER
Inventors Unit Survey
Students develop and conduct a survey for their inventors unit. They create a five question survey and tally the survey results, and create a graph using Microsoft Word and Graph Club 2.0.
Curated OER
Rolling Dice
Fourth graders investigate the mathematical concept of probability. They determine the given mean of a data set found when rolling dice. The results of the experiment are displayed using a bar graph. The teacher does an example before...
Curated OER
3rd Grade TAAS Attack Daily Upkeep #9
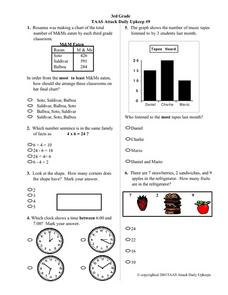
In this math literacy worksheet, 4th graders practice interpreting the pictographs in order to assemble the information to find the solutions to the 13 problems.
Curated OER
Differences between Climate and Weather
Young scholars collect weather data over weeks, graph temperature data and compare the temperature data collected with averaged climate data where they live.


