Curated OER
It's Your Choice
Students compare data and determine the appropriate way to organize the data. They use physical graphs, pictographs, and symbolic graphs to display their data. In addition, they complete a Venn diagram.
Curated OER
Understanding Cloud Formation
Students read and relate the poem, "Clouds" by Aileen Fisher to a demonstration on cloud formation. They create clouds in jars using ice water and matches then discuss the ways clouds can be used to predict weather.
Curated OER
Hare and Lynx Population
Fourth graders study changes in animal population. In this graphing instructional activity, 4th graders create graphs from information read to them about hares and lynx populations. They will describe patterns of change in the graphs and...
Curated OER
Do You Have a Coin Collection?
Learners create a graph showing which young scholars in the class collect coins.
Curated OER
How Far Can a Frog Jump?
Fourth graders are introduced to how to take measurements in the metric system. After defining new vocabulary, they read a story by Mark Twain about jumping frogs. In groups, they simulate a frog jumping contest in which they made...
Curated OER
Measuring the Speed of a Wave
Students create an experiment in which they measure the speed of a wave and record the data in a graph. They work in small groups to write the procedure for the experiment and share it with another group for cross checking of the...
Curated OER
Volatile Volcanoes
Students have fun with graphics, graphs and money, simultaneously learning with up-to-the-minute information.
Curated OER
One Square Foot
Students identify, describe, count, tally, and graph life found in one square foot of land.
Curated OER
Quadratics: vertex form
Students practice graphing quadratic equations to find the vertex of quadratic functions. They determine if the graph opens upward or downward as well as convert quadratic equations to vertex form from polynomial form. A lab version is...
Curated OER
The Great Turkey Walk
Young scholars formulate questions that can be addressed with data and collect, organize, and display relevant data to answer them. They wcreate bar graphs and pie graphs
Curated OER
Kansas Foods A Data and Probability Investigation
Students study a number of food products and anticipate which are derived from Kansas crops. They make a list of words associated with the food stuffs and graph the results.
Curated OER
Water Meter Reader
Learners examine a water bill from their household and examine it to find out how much water is used each month. They read their home water meters at the same time of the day for seven days and then construct a graph using their data.
Curated OER
Highs and Lows
Students use email to chart weather patterns and then graph their findings. For this weather patterns lesson, students chart their weather for a week at the school. Students then use email to find temperatures at a variety of locations....
Curated OER
Confusing Colors!
Fourth graders collect data, graph their data, and then make predictions based upon their findings. They's interest is maintained by the interesting way the data is collected. The data collection experiment is from the psychology work of...
Curated OER
Time, Tide, and Quahogs
Students read tide tables for Waquoit Bay as the simulate determining the best time to go clam digging for a Wampanoag clambake. They graph the tide tables while realizing that the tides a Waquoit Bay are one hour later than those at...
Curated OER
The Topsy-Turvy Twins
Fourth graders read the problem and brainstorm for ways to solve the problem - list these on the board for the students to refer to as they solve the problem. They work in pairs and focus on the strategy selected.
Curated OER
Sink or Float?
Students predict and explore to discover which objects sink or float in fresh and salt water, predict how salt affect objects, write predictions on T chart, discuss difference between man-made and natural waters, and graph results.
Curated OER
Closer To the Ground Lesson 2: Providing a Helping Hand
Learners examine how businesses and corporations contribute or sponsor activities for the common good. They read annual reports of major corporations to determine how they contribute to focused activities for the common good.
Curated OER
Inventors Unit Survey
Students develop and conduct a survey for their inventors unit. They create a five question survey and tally the survey results, and create a graph using Microsoft Word and Graph Club 2.0.
Curated OER
Mass Transit
Students explore the world of mass transit and how it affects their community as well as how it attempts to reduce our pollution mass. Included as well are the environmental and social factors relating to mass transit. They read and...
Curated OER
Hogs on a Diet
Students discuss the meaning of "hogging" something, and speculate on the origin of this phrase. They attempt to guess the contents of a shoe box (without looking inside). Students view feed grains and discuss animals that eat these...
Curated OER
How Does Your KinderGarden Grow
Learners find forecast and graph weather by using WeatherBug site, create flower books by using Wiggleworks, and plant radish seeds both on KidPix and in class garden.
Curated OER
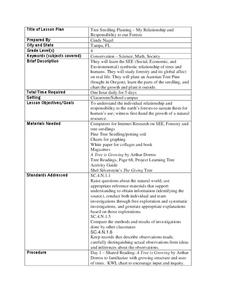
Tree Seedling Planting- My Relationship and Responsibility to our Forests
In this trees lesson, 4th graders read the book, A Tree is Growing and complete a KWL chart on how trees grow and how they are used. Students research the symbiotic relationship of humans and trees, create tree collages, plant a...
Curated OER
Iditarod
Fourth graders, after reading "Woodsong" by Gary Paulsen, explore/research what an Iditarod is and then create a speech about their selected musher and present their new found information to their classmates. In addition, they...


