Curated OER
Show Me!
Students analyze and interpret graphs. In this graphing lesson, students view a video and construct their own graphs (line, circle, bar) from given sets of data.
Curated OER
Fourth Grade Mathematics Quiz
For this math worksheet, 4th graders complete multiple choice questions about multiplication, bar graphs, rounding, and more. Students complete 15 questions.
Curated OER
Thanksgiving Dinner
Students plan a traditional Thanksgiving dinner. In this Thanksgiving instructional activity, students compare and contrast the first Thanksgiving to Thanksgiving celebrations today. Students plan a traditional Thanksgiving dinner and...
Curated OER
Getting There
Students practice reading a pictograph. In this data analysis lesson, students collect data and create their own pictograph. A students worksheet is included.
Curated OER
Beatrix Potter Book Survey
In this survey activity, students ask classmates which Beatrix Potter books they have read and record their responses. Book titles are listed in the first column and tally marks are written in the second column. Students then graph the...
Curated OER
Using Data
In this analyzing data worksheet, 4th graders read, study and interpret a bar graph on how many hours Millie spends a week drawing each day. Students answer 2 short answer questions relating to the bar graph.
Curated OER
Chapter Books
In this line plot worksheet, students create a line plot of the chapter books read by the students of a class and find the median and mode. Students complete 3 tasks.
Curated OER
Practice with Experiment Conclusions
In this conclusions worksheet, students write one sentence to summarize the data given to them in a graph. Students complete 3 problems.
Curated OER
My Test Book: Tally Charts
For this online interactive math worksheet, students solve 10 problems that require them to read and interpret tally chart data. Students may submit their answers to be scored.
Curated OER
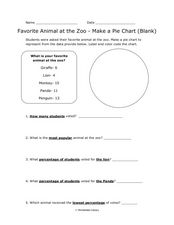
Pie Chart: Favorite Animal at the Zoo
In these three interpreting a pie chart and answering questions worksheets, students use the data provided to label and color code the blank and outlined pie charts, read and interpret a completed pie chart, and then answer questions...
Curated OER
All in the Family
Students use data to make a tally chart and a line plot. They find the maximum, minimum, range, median, and mode of the data. Following the video portion of the lesson, students will visit a Web site to test their data collection skills...
Curated OER
WebQuest: Thrills and Spills- Pick Your Park!
Students participate in a WebQuest in which they must determine which amusement park is the "median priced" park. Students visit park websites to accumulate prices for parking, activities, restaurants, and gift shops.
Curated OER
Integrated Social Studies and Math Lesson
Fourth graders study the American Civil War. They read and analyze information regarding the casualties of the Civil War, fucusing on Indiana soldiers. They graph the information and then write in their reflective journals responding...
Curated OER
Piece of Pie Chart
In this math worksheet, students examine a pie graph which shows a student's homework over 2 hours. Students read the information, then use a pie chart template (divided into 24 parts) to make their own homework chart.
Curated OER
Write Larger Numbers in Words or Figures
In this reading a bar graph worksheet, students identify numbers to answer word questions. In this short answer worksheet, students answer five questions.
Curated OER
Melissa's Garden
In this math activity, students identify the location of pictures on a coordinate plane. They write some answers as an ordered pair. They read ordered pairs and identify the picture at a specified location. Six problems are on a page. An...
Curated OER
Delicious Graphing
Fourth graders sort trail mix by type and use that information to create different types of graphs for comparing.
Curated OER
Graphing Ordered Pairs
In this math worksheet, students learn to graph ordered pairs. Students examine a graph with 3 labeled points and tell the ordered pairs for each. Students also plot 8 ordered pairs on a graph they draw themselves.
Curated OER
Graphs
Students list their favorite cars and create graphs of their favorites. Students determine how the graphs would change as their choices change.
Curated OER
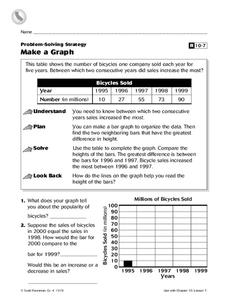
Make a Graph
In this graphs worksheet, 4th graders, after studying and analyzing a table on bicycles sold within several years, answer 2 short answer questions relating to the table.
Curated OER
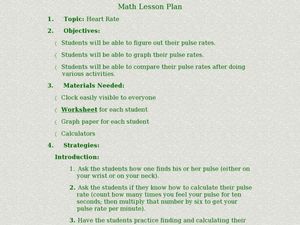
Graphing Heart Rates
Students explore heart rates. They record pulse rates, predict which exercises cause a faster heart rate, make a chart, and graph the results. Students write an essay using the data to support their predictions. They write a hypothesis...
Curated OER
Pictograph Activity
In this pictograph worksheet, students learn to read a pictograph and answer questions based on the data. Students then draw two of their own pictographs using the given information and answer questions based on graphs.
Curated OER
Favorite Book Graph
In this favorite book graph worksheet, students record each book that they've read during the year and create a graph on which books they liked the best.
Special needs in Music
Music Work Sheet (Special Ed)
Music is beneficial for all learners. Help your learners with special needs learn about different styles of music, as well as the ways that music is represented on paper, with 30 different worksheets.


