Curated OER
Trumpet of the Swan Favorite Character Graph
In this math and literature learning exercise, students survey classmates about their favorite character in the book Trumpet of the Swan. Students display the data on this blank bar graph.
Curated OER
Experiment Data Recording Sheet
In this science worksheet, students record data collected during a ten day experiment. They record the date and data collected for each of the ten days in a table on the sheet. They record the date since the data does not have to be...
Curated OER
Pascal
In this math worksheet, students perform the operations of addition and multiplication. They complete the squares modeled after Pascal.
Curated OER
A Charming Graph
In this a charming graph activity, students poll at least ten people to ask each one what their favorite charm is and then graph their data.
Curated OER
Math Facts Speed Drill
In this math worksheet, students complete a bar graph titled "Math Facts Speed Drill." Students include their scores over eight different trials.
Curated OER
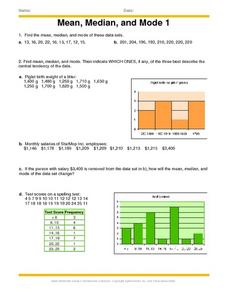
Mean, Median And Mode 1
In this mean, median and mode worksheet, learners problem solve and calculate the answers to ten word problems associated with the mean, median and mode of collected data.
Curated OER
Graph Paper
For this literacy worksheet, students are asked to complete the graphing activities using the newly created worksheets. The sheet itself is a guide for teachers to create graph paper styles.
Curated OER
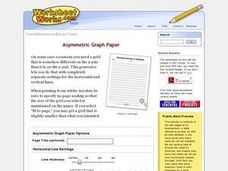
Asymmetric Graph Paper
In this literacy worksheet, students use the created asymmetrical graph paper for class activities. The sheet is intended to be a teacher's guide.
Curated OER
Axis Graph Paper
In this literacy worksheet, students use the axis graph paper that is created using this worksheet. The sheet is a teacher's guide.
Curated OER
Pie Chart
For this literacy worksheet, students use the created resources for further progress towards knowledge. The sheet is a teacher's guide for creating student resources.
Curated OER
Seasonal Graphs
In this math worksheet, students create a graph using the data recorded from the local newspaper concerning local temperatures.
Curated OER
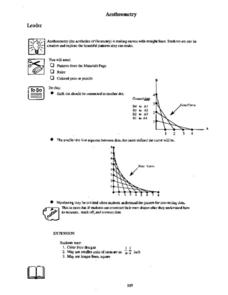
Aestheometry
Students explore the aesthetics of Geometry in this group activity, which provides a patterns page and a page for the leader of the group. Here, students create an eighth inch L shaped coordinate grid. They number the axis and use a...
Curated OER
Woodland Math Facts
In this Woodland math facts worksheet, students study and examine woodland weights of trees and shrubs, explore invertebrates and draw a bar chart to chart their findings.
Curated OER
Family Activity: Bar Graphs and Line Graphs
For this math worksheet, students work at home with a family member on a graphing activity. Students count the number of cans, glass jars, boxes and bags in the pantry. Students make a bar and a line graph to represent the data.
Curated OER
Expressions of Appalachian Mountain Folk
In this math worksheet, students plot the coordinates and then unscramble a code in order to decipher a riddle about the expressions used in the Appalachian Mountains.
Curated OER
Essential Skills Literacy
In this essential skills literacy learning exercise, students utilize a Thesaurus to look up words that have a similar meaning to the ones in each of the box drawings.
Curated OER
Smarties Investigation
In this math worksheet, students complete a variety of activities using Smarties candy. For example, students estimate the number of each color, count the actual amount, and record their results in a tally chart.
Curated OER
Smarties Pictogram and Bar Chart
For this math worksheet, students create a bar chart to illustrate the number of Smarties they have in each color. Students also draw a pictogram to represent the same information.
Curated OER
Where Did We Go on Holiday This Year?
In this differentiated whole-group activity worksheet, students list all the places they visited over the summer, record the places on a flip chart, calculate the distances on a road map and graph the data they collect.
Curated OER
You're in the Money
In this unique money scenario worksheet, students are told they are moving into a brand new four bedroom detached house and can spend as much as they like furnishing the house. Students make a list of the items and their cost of what...
Curated OER
Tally Charts
For this math worksheet, students complete 4 tally charts. Students use a list of information, such as colors or types of fruit, to create the charts.
Curated OER
Did You Eat That! - Food Graph
For this health and diet instructional activity, students ask ten of their friends what their favorite vegetables are. Then they tally their votes and shade them in on the graph provided.
Curated OER
Graph Integers
In this graphing worksheet, students are given blank graphs on which to correctly place 8 given integers given. A reference website is given for additional resources.
Curated OER
Tracing Worksheet
In this geometry learning exercise, students explore graphing characteristics. Students complete seven short answer and problem solving questions about graphing and whether or not one can be traced.


