Hi, what do you want to do?
Curated OER
Leaping Lemurs! How far can you jump?
Students watch a segment of the PBS video which show the lemurs' ability to jump. In pairs, students collect measurement data involving each other's length of a standard step, a standing broad jump, and a long jump. They record their...
Curated OER
Paper Parachutes
Pupils participate in a simulation of a parachute-jump competition by making paper parachutes and then dropping them towards a target on the floor. They measure the distance from the point where the paper parachute lands compared to the...
Curated OER
Oh Deer!
Students discuss the components necessary to keep animal populations alive . Then they participate in a game where they interact as deer, food, water, and shelter. The activity demonstrates that nature is not static, but changes with the...
Curated OER
"One Day in the Prairie" by Jean Craighead George
Learners collect "prairie insects" for data collection and analysis.
Curated OER
Around the World
Students explore ways people from around the world are like them. They discuss how geography affects the way people live and work and how culture affects a person's day to day life. Students give a presentation over a chosen country to...
Curated OER
Whose Breakfast isn't for the Birds?
Learners explore coffee production. In this cross-curriculum rainforest ecology lesson, students research regions where coffee comes from and investigate how the native birds in the rainforest are effected by coffee...
Curated OER
Comparison of Snow Cover on Different Continents
Students use the Live Access Server (LAS) to form maps and a numerical text file of snow cover for each continent on a particular date. They analyze the data for each map and corresponding text file to determine an estimate of snow cover...
Curated OER
Circle the Earth - Explore Surface Types on a Journey around Earth
Students use CERES percent coverage surface data with a world map in locating landmasses and bodies of water at Earth's Equator.
Curated OER
Checking County Numbers
Students use their county's information page to gather information about their community. Using the information, they create graphs from the tables provided and interpret the data. They write a paragraph showing their interpretation of...
Curated OER
A Real Difference
Fifth graders use the Celsius and Fahrenheit thermometers to compare temperature readings. They use the Internet to find the temperatures of selected cities. After data is collected for five days, 5th graders graph the temperatures.
Curated OER
Measurement: Using the balance
Students use a balance and gram cubes to measure several different objects. They then record their results on a data chart and answer questions about them.
Curated OER
Picture a Nation
Students research immigration data from a specific time period. They create a graphic organizer that depicts the information and share the information with the class.
Curated OER
Climate Comparison
Students explore climate regions. In this climate lesson plan, students examine the climate regions of Alaska as well as the state of Hawaii. Students research selected Internet sources to gather information regarding the climates...
Curated OER
FLIGHT FAIR
Learners conduct their personal investigations into paper airplane flight. Cooperative teams are formed, with students choosing the paper airplane design that they are most interested in building.
E-learning for Kids
E Learning for Kids: Math: Elephant Plant: Data and Graphs
On this interactive website students practice various math skills using a real-life scenario involving plants. Those skills include interpreting data in a circle graph, interpreting data in a divided bar graph, and interpreting a bar...
Other
Tulpehocken Area School District: Graphing and Analyzing Scientific Data
Student worksheet with explanation of pie, bar, and line graphs, the parts of a graph, and the definition of mean, median, and mode. This summary is followed by an exercise for each type of graph within a scientific context.
National Center for Ecological Analysis and Synthesis, University of California Santa Barbara
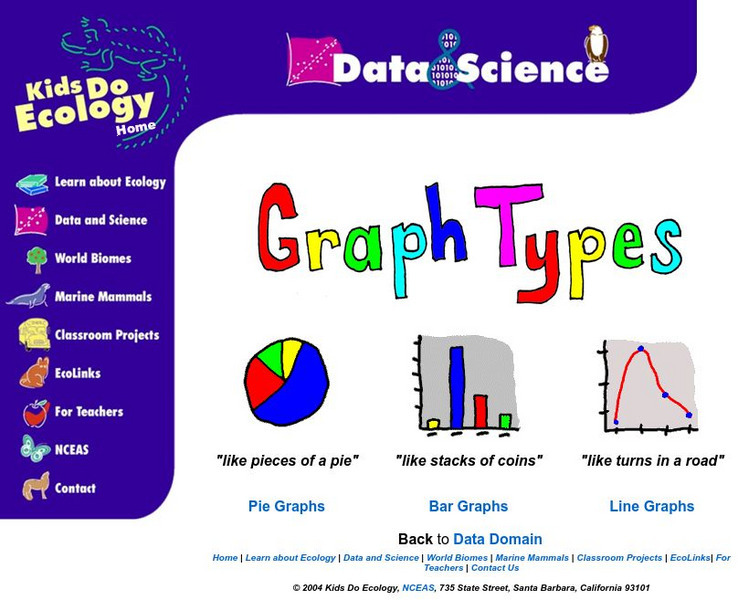
Nceas: Graph Types
At this site from NCEAS you can learn how to organize your data into pie graphs, bar graphs, and line graphs. Explanations and examples are given of each graph along with several questions that check comprehension.
US Department of Education
National Center for Education Statistics: Create a Graph Tutorial
This tutorial walks students through how to create different types of graphs using the Create a Graph tool available on the website. Covers bar graphs, line graphs, pie charts, area graphs, scatter plots, and dependent and independent...
Math Is Fun
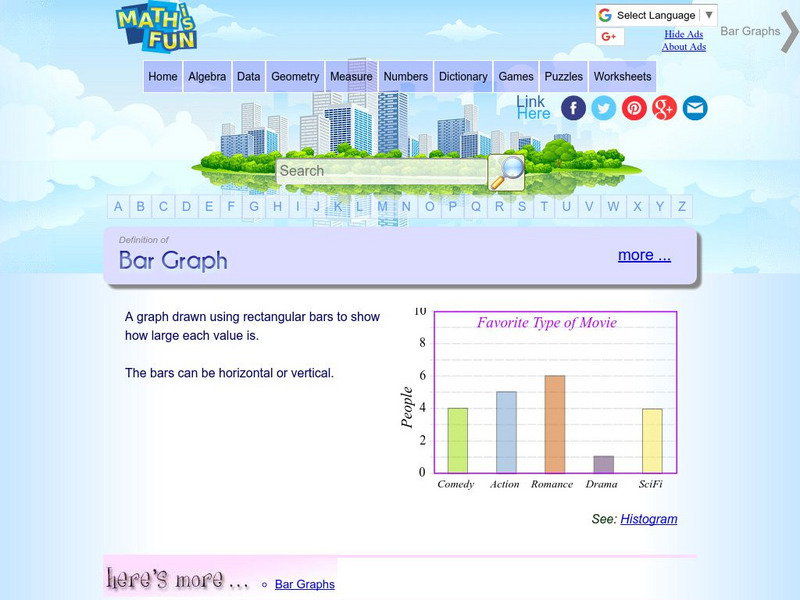
Math Is Fun: Definition of Bar Graph
Get the definition for a bar graph. Then, select the link "here's more" and use the interactive graph to display data as a bar graph, line graph or pie chart. The finished graph may be printed.
Math Is Fun
Math Is Fun: Data Graphs
Create and customize a bar graph, line graph, or pie chart based on a set of data and print it out.
Shodor Education Foundation
Shodor Interactivate: Misleading Graphs
This lesson will challenge students to think creatively by having them design and build water balloon catchers from random scrap materials, while requiring them to take into consideration a multitude of variables including cost,...
ClassFlow
Class Flow: Using Graphs in History Class
[Free Registration/Login Required] This flipchart covers the major types of graphs used in social studies such as bar graphs, line graphs, pie graphs, and pictographs. Information on graphs is followed by graphs dealing with salaries...
Education Development Center
Tune in to Learning: Reading Charts and Graphs
Practice graph reading skills with these exercises and companion tutorials.


