Activity
Math Is Fun

Math Is Fun: Definition of Bar Graph

For Students 3rd - 8th Standards
Get the definition for a bar graph. Then, select the link "here's more" and use the interactive graph to display data as a bar graph, line graph or pie chart. The finished graph may be printed.
Graphic
The Franklin Institute

Frankin Institute Online: Group Graphing

For Students 3rd - 8th Standards
This site from The Franklin Institute explores how to make a simple graph using a spreadsheet to portray survey data. It also gives a set of interesting sports-related web sites so that students can get statistical inforamtion.
Activity
Math Is Fun

Math Is Fun: Data Graphs

For Students 3rd - 8th Standards
Create and customize a bar graph, line graph, or pie chart based on a set of data and print it out.
Lesson Plan
Shodor Education Foundation

Shodor Interactivate: Misleading Graphs

For Teachers 4th - 8th
This lesson will challenge students to think creatively by having them design and build water balloon catchers from random scrap materials, while requiring them to take into consideration a multitude of variables including cost,...
Interactive
US Department of Education

Nces: Create a Graph: Kids Zone

For Students 3rd - 8th Standards
Make your own pie, bar, line, area or XY graph with this interactive tool. Look for examples of graphs already created from data collected by the National Center for Education Statistics. Complete with a graphing tutorial.
Whiteboard
ClassFlow

Class Flow: Using Graphs in History Class

For Teachers 5th - 8th Standards
[Free Registration/Login Required] This flipchart covers the major types of graphs used in social studies such as bar graphs, line graphs, pie graphs, and pictographs. Information on graphs is followed by graphs dealing with salaries...
Unit Plan
Education Development Center

Tune in to Learning: Reading Charts and Graphs

For Teachers 3rd - 8th Standards
Practice graph reading skills with these exercises and companion tutorials.
Unknown Type
Other

Tulpehocken Area School District: Graphing and Analyzing Scientific Data

For Students 4th - 8th
Student worksheet with explanation of pie, bar, and line graphs, the parts of a graph, and the definition of mean, median, and mode. This summary is followed by an exercise for each type of graph within a scientific context.
Activity
Scholastic

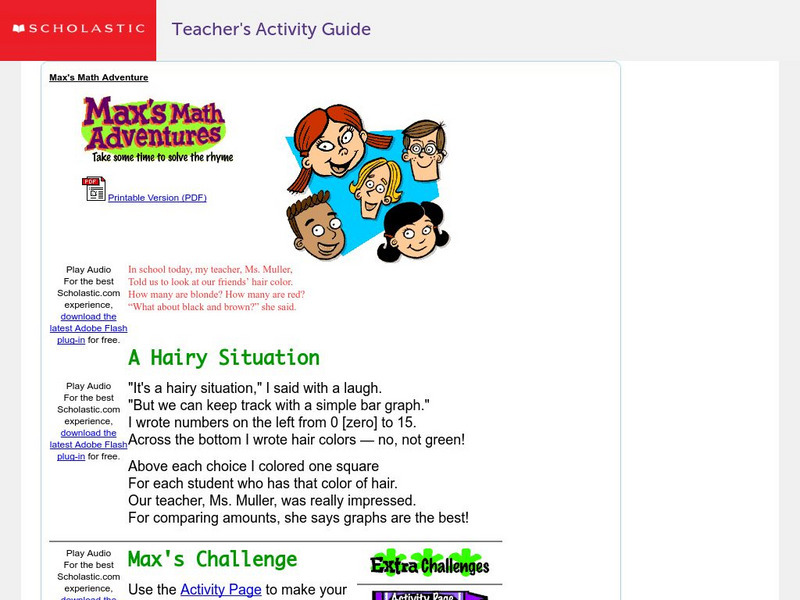
Scholastic: Max's Math Adventures: A Hairy Situation

For Teachers 3rd - 5th Standards
Help Max make a bar graph to show the hair colors of his classmates. Teachers will appreciate the activities with bar graphs in the extra challenges. Use the teacher's guide to create a fun and engaging lesson.
Activity
The Math League

The Math League: Using Data and Statistics: Pie Charts

For Students 3rd - 8th Standards
This introductory tutorial about statistical graphing with four examples of how pie charts (circle graphs) are constructed and read.
Lesson Plan
Alabama Learning Exchange

Alex: Ice Cream Sundae Survey

For Teachers 3rd - 5th Standards
Learners quickly realize the importance of learning how to read and find information in charts, graphs, and tables compared to finding the same information written in a paragraph. This is a fun, high energy lesson!This lesson plan was...
Lesson Plan
PBS

Pbs: Mathline Creature Feature Lesson Plan [Pdf]

For Teachers 3rd - 5th
An interdisciplinary math, science, and language arts lesson plan that engages students in an exploration of statistics. Through a study of various forest climates, students utilize data collection and analysis, classification, and...
Website
abcteach

Abcteach: Dinosaurs

For Teachers 3rd - 5th
[Free Registration/Login Required] This resource features a variety of activities related to dinosaurs. There are interdisciplinary tasks that include writing exercises such as creative writing and story planner formats. Lessons for...
Handout
US Geological Survey

Usgs: Water Science for Schools Uses of Saline Water

For Students 3rd - 8th
This U.S. Geological Survey website explains a variety of uses for saline water. Pie graphs and bar graphs are used to illustrate the various uses. Click Home to access the site in Spanish.
Activity
The Math League

The Math League: Ratio and Proportion

For Students 3rd - 8th Standards
This tutorial provides definitions and examples of ratios and proportions and features comparing ratios and converting rates.
Unit Plan
Khan Academy

Khan Academy: Read Histograms

For Students 5th - 7th
Practice reading and interpreting histograms. Students receive immediate feedback and have the opportunity to try questions repeatedly, watch a video or receive hints.