Curated OER
Application of Completing the Square
A TI technology activity that helps learners to recognize and use the characteristic of a perfect square quadratic to complete the square. Additionally, they apply their knowledge to solve real-world problems.
Curated OER
Graphing Exponentials
Bring your Algebra class to the computer lab! Using materials created by Texas Instruments, they explore exponentiasl and graphs. Be sure to download the correct materials (on the right side of the webpage) before having them walk...
Curated OER
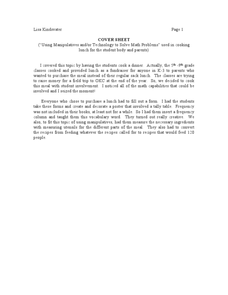
"Using Manipulatives and/or Technology to Solve Math Problems" by Cooking Dinner
Students explore math functions by preparing a meal. In this food measurement lesson, students examine a recipe for a meal and alter the size of the recipe based upon the amount of servings needed. Students utilize manipulatives to...
Curated OER
Math! What's It All About?
Twelfth graders determine what procedures they use to solve a problem and what areas of math they have difficulties with. In conjunction with their GED preparation, 12th graders review various ways to complete math problems and achieve...
Curated OER
Technology Integrated Lesson
Students investigate symmetry in the real world. In this geometry activity, students inter-relate math and technology. They create and name a variety of polygons.
Alabama Learning Exchange
WATER You Doing to Help?
Auntie Litter is here to educate young scholars about water pollution and environmental stewardship! Although the 15-minute video clip is cheesy, it's an engaging look at the water cycle and conservation. Learners start by illustrating...
Statistics Education Web
Text Messaging is Time Consuming! What Gives?
The more you text, the less you study. Have classes test this hypothesis or another question related to text messages. Using real data, learners use technology to create a scatter plot and calculate a regression line. They create a dot...
Statistics Education Web
NFL Quarterback Salaries
Use statistics to decide if NFL quarterbacks earn their salaries! Learners study correlation coefficients after using technology to calculate regression equations. Through the data, they learn the meaning of correlation and correlation...
Curated OER
Chances Are......You're Right
Young mathematicians study probability. In this math lesson, learners calculate odds, and convert those into percentages of probability. Fractions are also used, making this lesson quite rich in some of the more difficult conversions...
Virginia Department of Education
Logarithmic Modeling
Explore logarithms and logarithmic regression. Young mathematicians first learn about inverse functions and about the logarithm function family. They take their newfound knowledge to use logarithmic functions to model situations and...
Curated OER
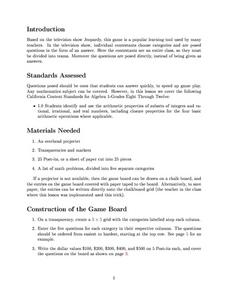
Mathematical Jeopardy
Middle schoolers use the popular game of Jeopardy to explore different mathematical concepts. They are highly engaged with the use of technology for this instructional activity. They function using higher-order thinking skills in order...
Utah Education Network (UEN)
Linear Graphs Using Proportions and Rates
Using a TI-73 or other similar graphing calculator middle school math majors investigate the linear relationship of equivalent proportions. After a brief introduction by the teacher, class members participate in a timed pair share...
Statistics Education Web
The United States of Obesity
Mississippi has both the highest obesity and poverty rate in the US. Does the rest of the data show a correlation between the poverty and obesity rate in a state? Learners tackle this question as they practice their skills of regression....
PBS
Surface Area and Volume
You and your class will like this lesson on using visual models to relate the volume and surface area of solid shapes. Learners construct three-dimensional forms using nets. They calculate the surface area and volume for each and then...
Curated OER
Calculators
Students investigate the four basic operations of mathematics that are addition, subtraction, multiplication, and division. The use of a technology game is part of the lesson. They demonstrate the proper use of a calculator as part of...
Curated OER
Two Variable Linear Equations
Everything you need to teach a lesson on two variable linear equations is right here. Objective, vocabulary, tech tips videos, and multiple downloadable files are all included. Learners will use the TI-Nspire technology to determine the...
Curated OER
Writing up Math in English
Seventh graders review the steps in writing a math problem. They write story problems stating the situation, the problem to be solved, explaining the process used to solve the problem, and state the answer. Students view a PowerPoint...
Curated OER
Math Instructional Technology Information
Students investigate the correlation between education and salary. In this business lesson, students analyze the salary rate for different jobs to determine if there is a correlation between the two. They graph their findings and report...
Curated OER
Math Lesson: What Do You Want to Know? - Country Statistics
Students are able to identify the characteristics of a variety of graphs (i.e. bar graph, line graph, pie graph, scatter plot, population pyramids, etc.) They recognize how the type of data to be presented plays a role in choosing the...
Curated OER
Math Today - World Population Milestones
Students use the data from USA TODAY Snapshot "World population milestones" to explore and explain the trends in the world population.
Curated OER
Math TODAY - The New Color of Money
Young scholars work with large numbers when determining the height of a stack of $20 bills.
Curated OER
Math TODAY Challenge - New Color of Money
Students read about the changes in the "new money" and then create a graph to represent various combinations of currency produced.
Teach Engineering
The Grand Challenge
Magnetic resonance imaging, just how safe is it? The introduction to unit study of magnetic resonance imaging technology presents the grand challenge questions of how an MRI machine works, the risks involved, the physics involved, and...
National Security Agency
Line Plots: Frogs in Flight
Have a hopping good time teaching your class how to collect and graph data with this fun activity-based lesson series. Using the provided data taken from a frog jumping contest, children first work together creating a line plot of the...


