Curated OER
2006 Census Teacher's Kit: Consequences Report Card
In this analyzing the Census worksheet, students assess the consequences of change using data from the 2006 Census. Students analyze the economic, social, and political wellbeing of each stakeholder.
Curated OER
Geometric Coordinates
In this geometric coordinates activity, learners solve and complete 3 different types of problems. First, they use the equations provided to complete the table on the right. Then, students plot the x- and y- coordinates on the graph to...
Curated OER
Measurement Reference Chart
In this measurement worksheet, students observe different ways to measure and find the equivalent of each of them to each other. Students observe 7 ways to measure and also see a chart with measurement symbols.
Curated OER
Graphing Inequalities
In this graphing inequalities worksheet, 6th graders solve and complete 24 different types of problems. First, they draw a graph for each given inequality. Then, students solve for each equation.
Curated OER
Design a Graphic Picture
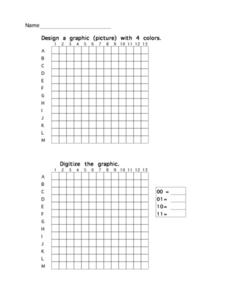
In this design a graphic picture worksheet, students design a picture on a grid using four colors. Next, they use a grid to digitize the graphic. This one-page worksheet contains two grids which are 13 x 13 in size.
Curated OER
Graph Paper
In this graph paper worksheet, students receive a blank piece of graph paper that they can complete graphs on. Students can have an unlimited amount of sheets.
Curated OER
Halloween Graph Paper
In this graph paper worksheet, learners improve their graphing skills using the graph paper. The paper is themed for a Halloween math activity.
Curated OER
Parabolas
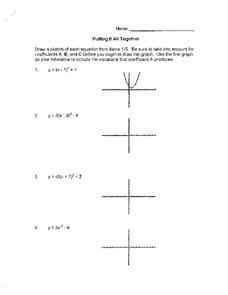
In this parabolas worksheet, students solve and complete 12 different types of problems. First, they draw a sketch of each equation shown. Then, students write the vertex form of each graph on the line provided.
Curated OER
Misleading Statistics
In this statistics instructional activity, 6th graders solve and complete 2 different problems. First, they use the graphs shown to determine the number of hours. Then, students use the graphs at the bottom to determine the profits...
Curated OER
Integers and Absolute Value
In this integers and absolute value worksheet, 6th graders solve and complete 24 problems. First, they write an integer for each situation described. Then, students evaluate each expression. They also graph each set of integers on a...
Curated OER
Constellations
In this constellations activity, students write their name as a constellation using an x and y-axis graph. This activity has 1 graph to create.
Curated OER
Solids, Liquids, and Gases
In this chemistry element worksheet, 7th graders complete three pages of activities that help them learn about solid, liquid, and gas forms.
Curated OER
Estimating
In this estimation worksheet, students estimate in word problems and graphs. Students round numbers to help them complete the estimation problems.
Curated OER
Investigating Exponents
In these exponents worksheets, 7th graders complete a table for numbers one through ten and their eight exponents. Students then examine the units digit of the entries in each table. Students look for patterns.
Curated OER
Time Zones (1)
In this time zones worksheet, learners complete a table for the time differences in London and Beijing. Students must calculate that both locations are eight hours apart.
Curated OER
First Ionisation Energies in Group II and Period 3
In this ionisation worksheet, students complete 2 graphic organizers by filling in the proton number for given elements. Then students create 2 graphs plotting first ionisation energy against the proton number.
Curated OER
Equations and Inequalities
In this equations and inequalities worksheet, 9th graders solve and complete 2 multiple choice problems. First, they read and identify the graph shown representing a given equation. Then, students determine the graph that best represents...
Curated OER
The Wooden 0
In this "The Wooden O" instructional activity, learners read about the first public theatres in London and answer discussion questions about attending a play during the 1500-1600's. Students then create a poster of the Globe theatre and...
Curated OER
Research Self-Checklist
In this research self-checklist worksheet, students evaluate their research presentations by checking off the quality features listed on the chart.
Curated OER
Counting Squares
For this counting squares worksheet, students solve 2 problems that include counting 2 different sets of squares. First, they draw a picture of four squares arranged in two rows of two. Then, students determine the total number of...
Curated OER
Solution Sets
In this solution set worksheet, 9th graders solve 5 different problems that include graphing on the x- and y-axis. First, they solve each inequality as needed. Then, students graph the solution set found in each on the coordinate plane...
Curated OER
Favorite Book Graph
In this favorite book graph worksheet, students record each book that they've read during the year and create a graph on which books they liked the best.
Curated OER
Blank Graph Paper
In this math activity, students use the template for graphing paper for the purposes of whatever activity is being used in the classroom.
Curated OER
Telephone Time
In this telephone time worksheet, students study, discuss and compare two sets of data when represented on the same graph. Students set up an original graph.


