Curated OER
Force and Gliders
Students explore physics by creating data graphs in class. In this flight properties lesson plan, students read the book Flying Machine and identify the force, resistance and construction necessary to keep a glider in the air. Students...
Curated OER
Spaghetti Bridges
Students thread a piece of spaghetti through the holes in the cup. One person suspend the cup by placing each index finger approximately one inch in from the ends of the spaghetti.
Curated OER
Graphs! Graphs! Graphs!
Students practice making charts and graphs from data on spreadsheets. Individually, they create a graph representing the latest information on voter registration. They answer questions and analyze the data to end the instructional...
Curated OER
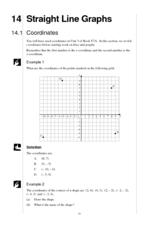
Straight Line Graphs
Learners review the techniques of plotting and reading points on a grid. They identify why facts explaining how to read coordinates as well as the importance of the order in which the coordinates are given. Individual practice of...
Curated OER
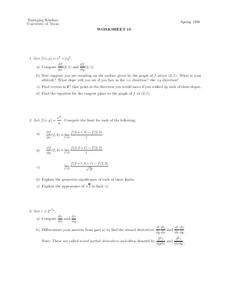
Worksheet 18
In this math activity, students graph the function. Then they determine the altitude in relation to the graph of the function using point (2,1).
Curated OER
Line and Double Line Graphs: Reteach
In this graphing worksheet, students review the five steps for making a double line graph to display data. Students then use the graph they made following the shapes to answer the three questions.
Curated OER
Canada's Climate: Temperature and Rainfall Variations
Middle schoolers analyze data about various climates in Canada. In this data analysis and climate lesson, students use Canada Year Book 1999 to complete a worksheet and make connections between precipitation and temperature in different...
Curated OER
Straight Graph Lines: Coordinates
Students access prior knowledge of coordinates. In this coordinates lesson, students graph coordinate points to create a symmetrical figure and of a straight line. Students complete several practice examples.
Curated OER
Kites: Patang - The Indian Fighter Kite
Students investigate the history of fighter kites and build their own. In this aeronautics lesson, students discover how other countries utilize fighter kites and where they originated. Students create their own fighter kites in class...
Curated OER
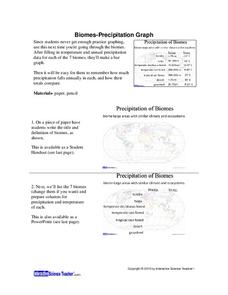
Biomes: Precipitation Graph
Students practice graphing by studying biomes. In this precipitation activity, students graph the precipitation patterns for the 7 biomes on Earth. Students view a PowerPoint presentation in class which explores the 7 biomes and the...
Curated OER
Solving Linear Equations
In this linear equations activity, students complete a total of 21 problems, connecting problems in column A to their corresponding answers in column B.
Curated OER
United States Population: Using Quadratic Models
In this United States population worksheet, students solve word problems about the United States population by using the quadratic formula. Students complete 6 problems.
Curated OER
Charting Attendance Rate of Busch Gardens
Sixth graders, in groups, are given different parts of the whole project. They use information from Busch Gardens to explore line graphs, averages, and other math vocabulary.
Curated OER
Transformations in the Coordinate Plane: Practice
In this transformations instructional activity, students identify the coordinates of triangle MNO after completing three translations and one reflection. Students use the triangle MNO with given coordinates to complete each...
Curated OER
Straight Line Graphs
Students discover certain equations produce straight lines. In this graphing lesson, students draw axis and problem solve to find coordinates to graph.
Curated OER
Name Count and Graph
Learners find the frequency of a name in selected states by using the Internet. They input data into a spread sheet. They create a graph that illustrates the gathered information.
Curated OER
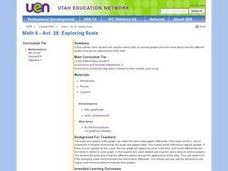
Exploring Scale
Sixth graders discuss how the scale and type of graph can change how the data appears. With a partner, they identify all the information about the graph in a specific amount of time and record them in a journal. To end the lesson plan,...
Curated OER
"Graph It"
Students work in teams to conduct short surveys of their classmates. They show their results using at least two different types of graphs.
Students separate into teams and are asked that each team to choose something that they are...
Curated OER
Graph Functions: Practice
In this graph functions learning exercise, students complete several activities to help them graph functions. Students use the table and the graph to complete the questions. Students also answer two test prep questions.
Curated OER
Transformations in the Coordinate Plane: Reteach
In this transformations learning exercise, students review the terms and example diagrams for a translation, reflection, and rotation. Students then identify the coordinates for a triangle after completing the given transformations in...
Curated OER
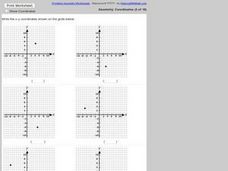
Identifying Points in the Coordinate Plane
For this ordered pairs worksheet, students identify 6 ordered pairs given a coordinate plane. Students list the ordered pair given the graph.
Curated OER
Surface Meteorological Observation System (SMOS)
Learners monitor local surface weather conditions for at least 30 days. They interpret the data by graphing it and detemining percentages.
Curated OER
Mapping an Artifact
Students copy a present day artifact onto graph paper. In groups, they decide the scale of the drawing and create the picture using specific graphing points. They are also given photographs in which there are no graphing points and they...
Curated OER
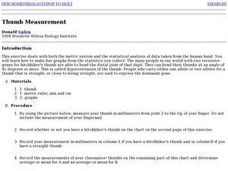
Thumb Measurement
Learners practice measuring using the metric system and millimeters. They measure their thumbs and record their findings. Students record the findings of their classmates and find the average or mean for the two groups.
Other popular searches
- X and Y Axis
- X Y Axis
- Reflection X Axis
- X and Y Axes
- Dependent Axes
- Axis (Axes
- Axes 0
- Stone Axes
- Graphing X Y Axis
- Independent Axes
- Reflection Across X Axis
- Horizontal and Vertical Axes


