Alabama Learning Exchange
The World of Integers
Review operations related to rational numbers and integers using the include PowerPoint presentation, "Interesting Integers." Young mathematicians classify rational numbers as being natural, whole, or integers and read an article about...
Noyce Foundation
Truffles
Knowing how to scale a recipe is an important skill. Young mathematicians determine the amount of ingredients they need to make a certain number of truffles when given a recipe. They determine a relationship between ingredients given a...
Curated OER
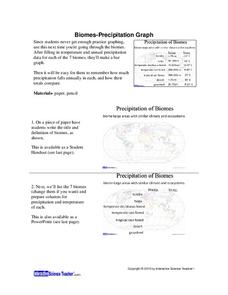
Biomes: Precipitation Graph
Students practice graphing by studying biomes. In this precipitation activity, students graph the precipitation patterns for the 7 biomes on Earth. Students view a PowerPoint presentation in class which explores the 7 biomes and the...
Curated OER
Highs and Lows
Plot data using the number line and discuss how negative numbers are used in math and science. Sixth and seventh graders share their graph with the class and provide an explanation for their plotting.
Pennsylvania Department of Education
The Multiplicative Identity and Numbers Close to One
Pupils practice multiplying and dividing whole numbers by fractions. They study the multiplicative identity property that states that the product of any number and 1 is that number. They multiply whole numbers by fractions close to 1 and...
Pennsylvania Department of Education
Problem Solving with Fractions
Solve story problems using fractions or decimals. Then, determine the reasonableness of answers using estimation.The detailed lesson includes essential questions, vocabulary, a materials list, and links to related units.
Curated OER
Lengths of Horizontal and Vertical Line Segments
Use this lengths of horizontal and vertical line segments practice instructional activity to have learners sharpen their problem solving skills as they solve six story problems.
Curated OER
Density of a Paper Clip Lab Review
Even though this assignment is brought to you by Physics Lab Online, it is best used as a math practice. Middle schoolers calculate the range, mean, mode, and median for a list of eight different paper clip densities. They analyze...
Curated OER
Drug Sales Soar - Rate of Change
In this prescription drug worksheet, students answer short answer questions and create graphs on the sales of prescription drugs over a five year span. Students complete six questions.
Curated OER
Mapping the Ocean Floor
Students construct and interpret a line graph of ocean floor depth and a bar graph comparing the height/depth of several well-known natural and man-made objects and places. In addition, they calculate the depth of two points using sonar...
Curated OER
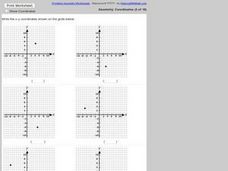
Naming Points on the Coordinate Plane
For this naming points on the coordinate plane worksheet, middle schoolers name 6 coordinates off of 6 graphs. Students name the x and y-coordinates of 6 different points in all four quadrants.
Curated OER
Operations and Coordinates: The Coordinate System
Young scholars play a "Battleship" type of game to practice graphing on a coordinate grid. In this graphing activity, students listen as the teacher explains quadrants and ordered pairs. They place their "ships" on the board. The teacher...
Curated OER
Plot the x-y Coordinates on the Grids Below
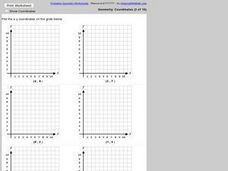
In this coordinate grid graphing worksheet, students plot the given points onto each of 6 coordinate grids. All points are located in quadrant 1. One point is plotted on each grid. Answers are given by clicking the appropriate place on...
Curated OER
Plotting Coordinates on a Grid
In this plotting points on a graph activity, students plot 6 points on 6 graphs. Students plot x and y-coordinates in the first quadrant.
Curated OER
Coordinate Grid: Mapping an Archaeological Site
Students examine how archaeologists preserve context of sites through use of rectangular grid or Cartesian coordinate system, and develop sense of distance by pacing off and estimating distances.
Curated OER
Interpreting Oceans of Data
Sixth graders analyze the data from a scientific experiment. In this statistics instructional activity, 6th graders answer questions about some data to show their understanding of the data. They apply the result to future decisions when...
Curated OER
Human Coordinate Plane
Students sit in 25 desks arranged in a square array. They are a human coordinate plane and each of them is to receive a card with an ordered pair (x,y) on it. They who are not seated distribute the ordered pair cards to the appropriate...
Curated OER
Straight Line Graphs
Students review the techniques of plotting and reading points on a grid. They identify why facts explaining how to read coordinates as well as the importance of the order in which the coordinates are given. Individual practice of...
Curated OER
United States Population: Using Quadratic Models
In this United States population worksheet, learners solve word problems about the United States population by using the quadratic formula. Students complete 6 problems.
Curated OER
Spaghetti Bridges
Students thread a piece of spaghetti through the holes in the cup. One person suspend the cup by placing each index finger approximately one inch in from the ends of the spaghetti.
Curated OER
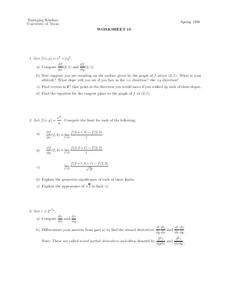
Worksheet 18
In this math worksheet, students graph the function. Then they determine the altitude in relation to the graph of the function using point (2,1).
Curated OER
Canada's Climate: Temperature and Rainfall Variations
Middle schoolers analyze data about various climates in Canada. In this data analysis and climate lesson, students use Canada Year Book 1999 to complete a worksheet and make connections between precipitation and temperature in different...
Curated OER
Identifying Points in the Coordinate Plane
In this ordered pairs worksheet, learners identify 6 ordered pairs given a coordinate plane. Students list the ordered pair given the graph.
Curated OER
Graph Functions: Practice
In this graph functions learning exercise, students complete several activities to help them graph functions. Students use the table and the graph to complete the questions. Students also answer two test prep questions.


