Curated OER
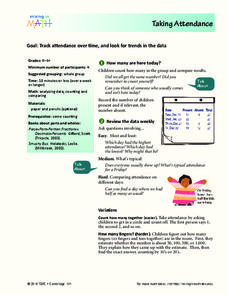
Taking Attendance
Young mathematicians record and analyze data. They will take attendance for their class and compare to other days. Then discuss ways to count who is present. They may also show the amount of students present using fractions.
Curated OER
Cutting Expenses
Students explore budgeting. In this finance and math lesson, students brainstorm ways in which households could save money. Students view websites that give cost reducing ideas. Students complete an expense comparison chart and use the...
Illustrative Mathematics
Data Transfer
A question to ask your class is, How fast is your Internet? That depends on the data transfer rate (DTR), which is the unit rate used in this activity. Math students will calculate how long it takes to download a music file and a video...
Curated OER
Data Analysis: Graphs, Charts, Tables, Statistics
In this data analysis worksheet, students interpret data in 5 problems involving graphs, tables, and scatterplots. Students construct 1 stem and leaf plot and find the mean, median, and mode of a data set.
Curated OER
Ornithology and Real World Science
Double click that mouse because you just found an amazing lesson plan! This cross-curricular Ornithology lesson plan incorporates literature, writing, reading informational text, data collection, scientific inquiry, Internet research,...
EngageNY
Describing Variability Using the Interquartile Range (IQR)
The 13th instructional activity in a unit of 22 introduces the concept of the interquartile range (IQR). Class members learn to determine the interquartile range, interpret within the context of the data, and finish by finding the IQR...
Virginia Department of Education
May I Have Fries with That?
Not all pie graphs are about pies. The class conducts a survey on favorite fast food categories in a lesson on data representation. Pupils use the results to create a circle graph.
EngageNY
The Mean Absolute Deviation (MAD)
Is there a way to measure variability? The ninth resource in a series of 22 introduces mean absolute deviation, a measure of variability. Pupils learn how to determine the measure based upon its name, then they use the mean absolute...
Bowland
Football, the Beautiful Game
Discover how to use mathematics to make a stronger soccer team. Young soccer enthusiasts use given data to make decisions about a soccer team. They decide which position to assign each player, consider what makes a good pass and...
Curated OER
The Dog Days of Data
Learners are introduced to the organization of data This lesson is designed using stem and leaf plots. After gather data, they create a visual representation of their data through the use of a stem and leaf plot. Students
drawing...
Curated OER
Box Plots
Young statisticians are introduced to box plots and quartiles. They use an activity and discussion with supplemental exercises to help them explore how data can be graphically represented.
Curated OER
Fire Wars
Your class can practice collecting and analyzing data. They extrapolate information and derive data from fire season statistics. They also choose the most appropriate format to display collected data.
Curated OER
Raisin the Statistical Roof
Use a box of raisins to help introduce the concept of data analysis. Learners collect, analyze and display their data using a variety of methods. The included worksheet takes them through a step-by-step analysis process and graphing.
Curated OER
Mean, Median, Mode, Range
Learners engage in a study of mean, median, mode, and range in order to represent data in tables. They are also exposed to the results of data that is skewed because of the outlier.
Curated OER
Data Handling: Bar Chart Showing Frequency
In this bar graph learning exercise, students analyze a bar graph showing soccer goals scored. Students then use the data to solve 7 problems.
Curated OER
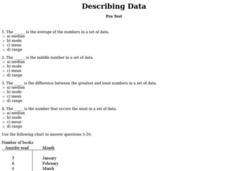
Describing Data
For this data worksheet, students complete multiple choice questions about mean, median, mode, and range. Students complete 10 questions total.
Curated OER
Collecting And Organizing Data
In this collecting and organizing data worksheet, students, with a partner, problem solve and calculate the answers to six mathematical word problems.
Curated OER
Organising Data
Students complete data organization activities. For this data organization lesson, students watch online clips about organizing data. Students complete an eye color frequency table for their class. Students watch a clip about asking...
EngageNY
Describing Center, Variability, and Shape of a Data Distribution from a Graphical Representation
What is the typical length of a yellow perch? Pupils analyze a histogram of lengths for a sample of yellow perch from the Great Lakes. They determine which measures of center and variability are best to use based upon the shape of the...
EngageNY
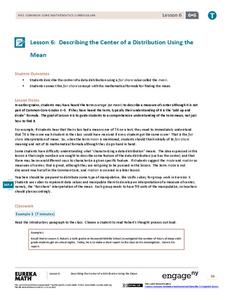
Describing the Center of a Distribution Using the Mean
Everyone does their fair share. The sixth segment in a 22-part unit presents the mean as a fair share. Groups build a conceptual understanding of the mean of a data set, rather than simply learn an algorithm. Learners use the...
CK-12 Foundation
Understand and Create Histograms: Car Sales
Create a history of car sales. Pupils create a histogram/bar graph to show the number of car sales made during the week. Using the data display, learners calculate numerical summaries of the data and find the percent of cars sold during...
CK-12 Foundation
Two-Sided Stem-and-Lead Plots: Gamers
Which gender spends more time playing video games? Your classes use provided data to answer this question. They first build a two-sided stem-and-leaf plot and then use the display to look for patterns. Guiding questions help them...
Curated OER
Mean, Median, Mode, and Range - Homework 14.3
In this data and statistics activity, students find the mean, median, mode, and range of 4 different sets of data. Next, students solve 1 word problem where they find the mean.
Curated OER
What's Your Average? What Do You Mean? I'm More Than Just Average
Upper grade and middle schoolers collect data, analyze and interpret the data. This three-part lesson should provide learners with a firm understanding about the differences between mean, median, and mode and how to perform the...
Other popular searches
- Data Sets Data Collection
- Linear Data Sets
- Comparing Two Data Sets
- Quadratic Data Sets
- Data Sets and Graphs
- Compare Related Data Sets
- Experiments and Data Sets
- Correlation of Data Sets
- Create Data Sets
- Circle Graph Data Set
- Compare Data Sets
- Compare Two Sets of Data


