Illustrative Mathematics
Riding at a Constant Speed, Assessment Variation
Practice ratios and unit rates with tracking how long Lin took to ride her bike. Provided with different questions, your mathematicians can assemble their answers using a chart or setting up ratios. The activity is included in a set of...
Illustrative Mathematics
Molly's Run, Assessment Variation
Part of as assessment series, the activity follows the lesson Molly's Run to practice ratios and dividing with fractions. Different solution options are given for your learners' preference. The commentary explains how the standards...
Bowland
Speed Cameras
Do speed cameras help reduce accidents? Scholars investigate this question using a series of spreadsheet activities. Along the way, they learn about randomness, probability, and statistical analysis.
Curated OER
Roaming Robot
Students give directions to help a classmate find an object. In this direction lesson plan, students tell the finder where to travel and how many steps to take. More difficult directions include angled turns.
Curated OER
Frost Depth Study
Students complete activities to study the frost and frost depth. In this frost study lesson, students use frost tubes to study and measure the frost at their school. Students measure the frost in the tube and enter their data online to...
Curated OER
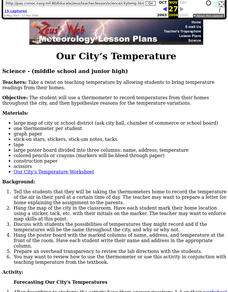
Our City's Temperature
Students use a thermometer to record temperatures from their homes throughout the city, and then hypothesize reasons for the temperature variations. They use a weather graph worksheet that's imbedded in this lesson to orgainize their data.
Curated OER
Temperature High and Lows
Young scholars gather high and low temperature readings through email. In this temperature graphing lesson, students use a spreadsheet to input data for a graph. young scholars interpret the graphs to compare and contrast the data from...
Desert Discovery
Leaping Lizards
Here is a fine biology lesson that introduces youngsters to reptiles. They study their feeding habits, their habitats, and the adaptations they must make to survive in their environments. The outstanding lesson includes two excellent...
Curated OER
Manatee Awareness Survey
Students examine the public's awareness of manatees by taking a survey. They display the results of the survey as a graph.
Curated OER
Asthma Survey
Students collect survey data on the prevalence of asthma in a community. They summarize and display the survey data in ways that show meaning.
Curated OER
Do the Elephants Need Sunscreen? A Study of the Weather Patterns in Etosha
Students analyze the weather patterns in Namibia. They create a graph of the yearly temperatures and use the internet to gather information. They discuss how the weather goes in cycles in the area.
Curated OER
Pumpkin Seed Multiplication
Students practice multiplication facts. In this multiplication lesson plan, students participate in a pumpkin seed multiplication game where they match up addition sentences and multiplication facts. Game board and number sentences are...
Curated OER
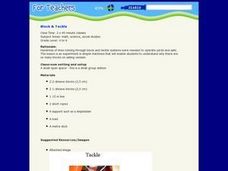
Block & Tackle
Students participate in a lab experiment in which they discover the need for so many blocks and tackles on sailing ships. In groups, they make and test their predictions and practice measuring objects in various units. They record and...


