Curated OER
Mean, Mode, Median, and Range
For this math worksheet, students read about the mean, mode, median, and range. Students analyze a color-coded example problem for each.
Teacher's Corner
Brandon's Baseball Collection
Ten questions make up a worksheet that challenges baseball enthusiasts to read a graph then answer questions pertaining to the data's range, mean, median, and mode.
Curated OER
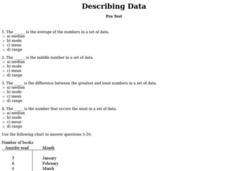
Describing Data
In this data worksheet, students complete multiple choice questions about mean, median, mode, and range. Students complete 10 questions total.
Curated OER
More Jelly Bean Math
Students use their color categorized jelly beans to find the range, mean, median and mode. They use their recorded data documenting how many jelly beans there are for each color in order to calculate the range, mean, median and mode of...
Curated OER
My Test Book: Mean, Median, and Mode
In this math skills learning exercise, students solve 10 multiple choice math problems regarding mean, median, and mode. Students may view the correct answers.
Curated OER
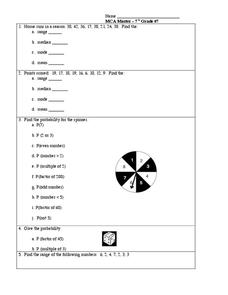
Probability and Statistics
In this probability and statistics worksheet, students complete 5 problems regarding range, mean, median, mode, and a spinner probability problem.
Curated OER
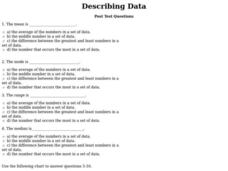
Describing Data
In this describing data worksheet, students answer multiple choice questions about mean, median, mode, and range. Students complete 10 questions total.
Utah Education Network (UEN)
Statistics
Find the value in analyzing data values. Statistics is the focus in the fifth of seven installments of the 6th Grade Math series. Individuals learn to examine dot plots, histograms, and box plots by considering the shape, mean, median,...
Curated OER
Survey: What Shape Has More In the Lucky Charms Box?
In this Lucky Charms instructional activity, students identify the shapes in the box, and using tally marks, count how many of each shape are included. This instructional activity may be used in elementary grades, for counting and tally...
Curated OER
Out to Lunch
Sixth graders create a menu. For this math lesson, 6th graders use mean, median and mode to determine the prices for the typical cost of an appetizer, entree, kid's meal, drinks and dessert. Students write a number sentence to show how...
Curated OER
Mode, Median, and Mean
Young scholars define mode, median and mean, and perform mathematical operations to determine these 3 terms. In this statistics/math lesson plan, students practice memory strategies to help distinguish between mode, median, and mean....
Curated OER
Stem-and- Leaf Plots
Learners are introduce to the notion of stem-and-leaf plots. They use stem-and-leaf plots to calculate the mean, median, and mode of a set of data. Students use computers to learn about stem-and-leaf plots.
Curated OER
Campaign 2000
Learners research newspapers and the Internet to learn about the election. Students work in groups and choose a state that they want to compare to Florida. Learners organize the data they have found into a graph labeling an "x" and "y"...
CK-12 Foundation
Understand and Create Histograms: Histograms
Determine the shape of weight. Using the interactive, class members build a histogram displaying weight ranges collected in a P.E. class. Scholars describe the shape of the histogram and determine which measure of central tendency to use...
Curated OER
Data Analysis
In these analyzing data worksheets, learners complete a table and a pie chart and calculate mean, median, mode, and range for sets of data.
Curated OER
Batter Up! Math Stations
Math stations that review important concepts with the real-world example of baseball.
Curated OER
Describing Range and Measures of Central Tendency in Shoe Sizes
Students describe the range and various measures of central tendency using shoe sizes from a video. In this range and measures of central tendency lesson, students use the same data set to identify the concepts of range, mode, median,...
Noyce Foundation
Through the Grapevine
Teach statistics by analyzing raisins. A thorough activity provides lesson resources for five levels to include all grades. Younger pupils work on counting and estimation, mid-level learners build on their understanding of the measures...
Curated OER
Averages
In this averages worksheet, 6th graders solve and complete 3 various types of problems. First, they find the mean, mode, median and range for each set of data shown. Then, students match each team to the picture shown that they think...
David Pleacher
Candy Math Fun
Few things can motivate children to learn like the promise of a sweet and tasty treat. Given a bag of M&M®s, Skittles®, or other colorful candy, students first predict the contents of the bag before counting the pieces, creating a...
Curated OER
Stem-and-Leaf Plots
Students are introduced to stem-and-leaf plots and calculating the mean, median, and mode from the plots.
Curated OER
Lessons for Atlatl Users with Some Experience-Grade 6
Sixth graders experiment with an atlatl and dart. In this sixth grade data management mathematics lesson, 6th graders explore and determine the most suitable methods of displaying data collected from their experimentation with throwing...
Curated OER
Mean Absolute Deviation in Dot Plots
The lesson focuses on the ideas of dot plot representations and the mean absolute deviation of data sets.
National Museum of Mathematics
Hands-On Data Analysis
Jump at the chance to use this resource. A kinesthetic activity has classmates jumping in several different ways (standing, single-step, and multiple-step jumps) to create handprints on poster paper taped to the wall. They measure the...
Other popular searches
- Range, Mean, Median, Mode
- Range Mean Median Mode
- Mode, Range, Mean, Median
- Range, Median, Mode, Mean


