PBS
From Patterns of Input and Output to Algebraic Equations
Watch video clips titled, "Frog Hops Part I" and "Frog Hops Part II," then discuss patterns demonstrated in the videos. Learners will complete an algebraic expressions and equations handout and discuss the answers. They will be able to...
Curated OER
Interpreting Graphs
Sixth graders interpret linear and nonlinear graphs. They create graphs based on a problem set. Next, they represent quantitive relationships on a graph and write a story related to graphing.
Curated OER
The Art of Interpreting Percent
Ddefine the relationships between fractions, decimals, and percentages in a series of lessons. The class practices converting between these three versions of a number. They also find the common factor of a numerator and denominator and...
American Statistical Association
Exploring Geometric Probabilities with Buffon’s Coin Problem
Scholars create and perform experiments attempting to answer Buffon's Coin problem. They discover the relationships between geometry and probability, empirical and theoretical probabilities, and area of a circle and square.
Illustrative Mathematics
Reasoning about Multiplication and Division and Place Value, Part 1
Help your class make sense of quantities and their relationships. Given is the product of two numbers. It is up to your number crunchers to think about the quantitative relationship when the product is one-tenth or ten times the product...
Santa Barbara City College
How to Make a Multiplication Table
Teach children how to make a multiplication table, and they'll be multiplying for life. Following this series of steps, young mathematicians learn to use patterns and the relationships between numbers to create their very own...
Super Teacher Worksheets
Improper Fractions & Mixed Numbers
Young mathematicians demonstrate their understanding of part-whole relationships in a fraction skills worksheet. Presented with a series of mixed numbers and improper fractions, learners must correctly convert each of them into their...
Mathematics Assessment Project
Shelves
Don't leave this task on the shelf — use it is assess middle schoolers understanding of patterns. Participants try to discover a pattern in the number of bricks and planks used to make shelves. They then match descriptions and equations...
Education Development Center
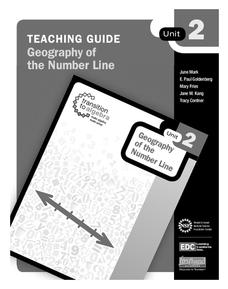
Geography of the Number Line
It's more than just numbers on a line, its an organizational, mental math machine to help learners understand the value of numbers. The tool is handy when introducing positive and negative integers to see their values and relationships....
Noyce Foundation
Piece it Together
Score some problems all related to soccer balls. The first few problems focus on pattern blocks to see relationships between figures. More advanced problems focus on actual soccer balls, the patterns on the balls, and their volumes and...
EngageNY
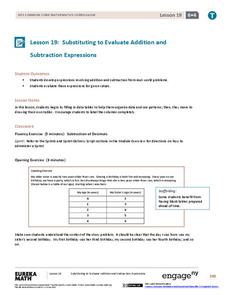
Substituting to Evaluate Addition and Subtraction Expressions
Substitute this resource for what you used to use. Learners identify patterns in data tables and write addition and subtraction expressions to represent relationships. Substitution allows them to solve problems in context in the 20th...
EngageNY
Problems in Mathematical Terms
Whether scholars understand independent and dependent variables depends on you. The 32nd installment of a 36-part series has learners analyze relationships in real-world problems through tables. They determine independent and dependent...
EngageNY
Multi-Step Problems in the Real World
Connect graphs, equations, and tables for real-world problems. Young mathematicians analyze relationships to identify independent and dependent variables. These identifications help create tables and graphs for each situation.
EngageNY
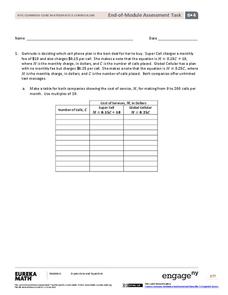
End-of-Module Assessment Task: Grade 6 Math Module 4
Finish out the module with a bang. The last installment of a 36-part module is an end-of-module assessment task. Test takers set up equations to represent relationships and solve problems in an assortment of contexts.
CK-12 Foundation
Function Rules for Input-Output Tables: Soda Sugar Function Table
Examine the relationship between the input and output variables in a table of values. As learners build an input-output table using online manipulatives, they begin to identify patterns. They answer questions about these patterns and...
Utah Education Network (UEN)
Ratio Relations
At this rate, the class will be experts on ratios and rates in no time. A class workbook teaches individuals about ratio language, using tables and tape diagrams to find equivalent ratios, and solving ratio problems. They then discover...
Curated OER
A Special Relationship
Students discover the relationships of the lengths of the sides of right triangles and right triangles using a series of drawings on dot paper. They investigate and solve problems of standard (customary and metric units) and non-standard...
Curated OER
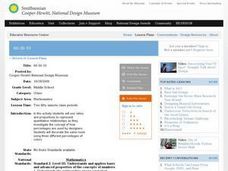
60-30-10
Students use ratios and proportions to represent quantitative relationships as they investigate the concept of how percentages are used by designers. Students decorate the same room using three different percentages of colors.
Curated OER
Introducing the Concept: Percents
Students explore the math concept of percents. In this percents instructional activity, students examine visual examples of the relationships among fractions, decimals, and percents. Students also practice solving problems that their...
Curated OER
Web Adventure -- Oakland to Chicago Flight
Students develop an awareness of mathematics in a diverse number of careers, then describe three duties of a pilot that require mathematical skills. They increase understanding of interpreting data relationships presented in table format.
Curated OER
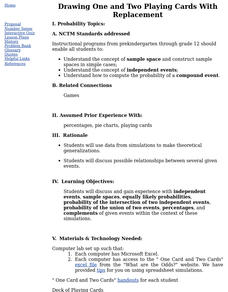
Drawing One and Two Playing Cards With Replacement
Math whizzes use data from simulations to make theoretical generalizations and discuss possible relationships between several given events. They use a simple card game to generate data to be analyzed.
Curated OER
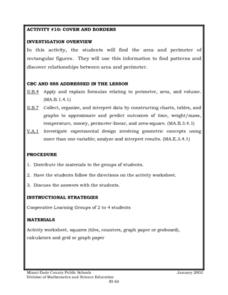
Cover and Boarders
Young scholars find the area and perimeter of rectangular figures. They use this information to find patterns and discover relationships between area and perimeter. Students apply and explain formulas relating to perimeter, area, and...
Curated OER
Area and Perimeter Relationships
Sixth graders explore the relationship between area and perimeter. After discovering the definition of perimeter, 6th graders work together to create designs for a flower bed. They observe that the perimeter remains constant even...
Curated OER
Divisor/Quotient Relationships
In this division worksheet, learners divide problems with decimals to find the quotient. Students complete 19 problems all together.
Other popular searches
- Healthy Relationships
- Interpersonal Relationships
- Linear Relationships
- Quadratic Relationships
- Ecological Relationships
- Family Relationships
- Symbiotic Relationships
- Angle Relationships
- Family Health Relationships
- Economic Relationships
- Cause and Effect Relationships
- Relationships Among Organisms


