Curated OER
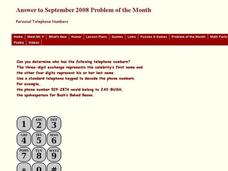
Telephone Numbers
In this three-digit identification learning exercise, learners determine who has each of the telephone numbers listed using the key shown. They also use a standard telephone keypad to decode the phone numbers with the correct letters in...
Curated OER
Maverick
Students apply probability to real life situation. In this statistics instructional activity, students play poker and make predictions on what hand they will get next. They apply their knowledge of how probability works to make their...
Curated OER
Mean, Median, and Mode
Students calculate the mean, median, and mode in a set of numbers. In this data analysis lesson, students put a set of numbers in ascending order and perform calculations to find the mean, median, and mode.
Curated OER
Probability
In this probability worksheet, 6th graders solve and complete 3 different problems. First, they place the events on the probability scale shown. Then, students match the phrase to the best description of its chance of happening.
Curated OER
Using Current Data for Graphing Skills
Students graph demographic information. In this graphing lesson, students choose what type of graph to create and what information to display. Links to examples of graphs and statistical data are provided. The graphs are created on the...
Curated OER
Misleading Statistics
In this statistics instructional activity, 6th graders solve and complete 2 different problems. First, they use the graphs shown to determine the number of hours. Then, students use the graphs at the bottom to determine the profits...
Curated OER
Probability Two Dice
In this probability activity, students solve and complete 2 different problems related to rolling two dice. First, they select one number from 2 to 12. Then, students roll the dice over and over again until one person's number comes up....
Curated OER
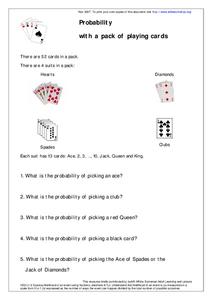
Probability
In this mathematical probability learning exercise, students utilize a deck of cards to problem solve five questions associated with a deck of cards and probability.
Curated OER
Cricket 2007
In this math and sports worksheet, students read and review the statistics from the performance of teams in the Cricket World Cup. They identify which team played the most matches and who won the most. Students also compare the...
Curated OER
Standard Sizes of Paper
Middle schoolers measure the dimensions of different sizes of paper. Using a copy machine, they discover dilations. After enlarging and shrinking particular copies, students examine rates, ratios and percentages and discover the...
Curated OER
Monitoring Math with a Statistical Spreadsheet
Students use a spreadsheet to compute landmark statistics of a math
quiz. This lesson can be ongoing throughout the school year and it integrates mathematics curriculum and technology in a simple format for student use.
Curated OER
No-Three-In-A-Line Game
Young scholars use logic and reasoning to answer problems. Through interpreting information and results in the context to examine patterns. They examine how to solve the problems using strategy in mathematics.
Curated OER
Math: Reasoning and Problem Solving using Voyages
Learners plan a voyage as the captain of a tall ship in the early days of exploration and merchant trading. They choose 2 ships and 3 voyages for a total of 6 possibilities. They calculate the number of days and distance of their...
Curated OER
How's the Weather
"How's the Weather?" is an exercise that combines science and math as learners graph the weather along the Iditarod Trail. They complete a double-line graph of the weather of a chosen checkpoint over the course of one week. Students...
Curated OER
Manatee Awareness Survey
Students examine the public's awareness of manatees by taking a survey. They display the results of the survey as a graph.
Curated OER
Using Computer for Statistical Analysis
Students examine the use for spreadsheets in analyzing data. They make spreadsheets that display and calculate a given data set such as temperature change.
Curated OER
Time, Tide, and Quahogs
Students read tide tables for Waquoit Bay as the simulate determining the best time to go clam digging for a Wampanoag clambake. They graph the tide tables while realizing that the tides a Waquoit Bay are one hour later than those at...
Curated OER
Tourism in London
Students discuss the tourist attractions that are in London. They examine how data can be manipulated by completing a worksheet. They plan a trip to a London attraction after conducting Internet research.
Curated OER
What Does Your School Think of Fair Trade?
Students design and conduct a survey in order to assess the local opinion and knowledge regarding Fair Trade chocolate. They use the results to design a Fair Trade promotion at school.
Curated OER
Code Breakers
Students collect data and make a frequency table, change ratios into percents, and analyze data to make predictions.
Curated OER
Probability Using M & M's
Students develop an understanding of probability by sorting bags of M & M's by color and recording the results in percents. The data is entered onto a spreasdsheet and graphed.
Curated OER
Chesapeake Bay Population Studies
Learners use quarter meter2 quadrant to determine population density, relative density, frequency, relative frequency, calculate diversity index, and establish correlation of association between any two species.
Curated OER
Drawing Conclusions
Students play a probability game, then design and complete a probability problem concerning changing odds.
Curated OER
Lucky Number
Students use data from simulations to make theoretical generalizations. They discuss possible relationships between several given events and gain understanding about their own mathematical intuition about likelihood.


