Curated OER
Rational, Irrational and Square Roots
Seventh graders identify rational and irrational numbers and then, estimate the square root of numbers that are not perfect squares. They then identify what the radical is and differentiate between that and a division symbol clearly....
Curated OER
Models and Algorithms to Solve Multiplication Problems
Students choose the correct strategy to solve multiplication and division. In this algorithm lesson, students use at least two strategies that use properties of operations and estimation. Students also recognize the relationship between...
Curated OER
Estimating Percents
In this math worksheet, students complete 25 problems where they estimate the percentage of shaded figures, fractions of a whole, and by solving word problems which use percents.
Curated OER
Multiplying Decimals and Mixed Numbers
Middle schoolers multiply decimals and/or mixed numbers. They explore the effects of multiplying decimals and mixed numbers. They practice estimating answers when a number is multiplied by a decimal or mixed number.
Curated OER
"How Big is a Foot?" by Rolf Myller
Middle schoolers use estimation and fractions and standard units of measure to measure foot strips.
Curated OER
Buying My First Car
Students pretend they are about to buy their first new car. They must do all the calculations necessary to estimate the cost of purchasing the car. They see that the math they learn in school really does have real-life applications.
Curated OER
The Take-Awar Bar 1
Students use an Internet tool, "The Take-Away Bar" to solve subtraction problems by breaking them into parts. They write and solve comparison problems. Students make sensible estimates and check the reasonableness of answers. They use...
Curated OER
Venn Diagrams & Word Problems
Students explore the concept of Venn Diagrams through word problems. In this Venn Diagram lesson, students solve word problems about groups of people using Venn Diagrams. Students use survey results about MySpace and Facebook in a Venn...
Illustrative Mathematics
Miles to Kilometers
Can your mathematicians come up with an easy way to convert miles to kilometers? Start by asking learners to write an algebraic expression for each of the descriptions given. Once they determine that they are both the same, ask...
Illustrative Mathematics
Stained Glass
A complex question looking for the total cost of a stained glass window by calculating area and circumference of a circle. With detailed components, this activity will challenge your designers to figure out if they have enough money to...
Noyce Foundation
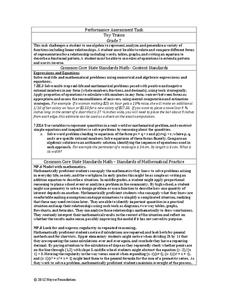
Toy Trains
Scholars identify and continue the numerical pattern for the number of wheels on a train. Using the established pattern and its inverse, they determine whether a number of wheels is possible. Pupils finish by developing an algebraic...
Curated OER
Minnesota-China Connections:What Time Is It?
Students calculate the time difference between Beijing, China and their local community. They discuss how time difference affects intercultural communication.
Curated OER
60-30-10
Students use ratios and proportions to represent quantitative relationships as they investigate the concept of how percentages are used by designers. Students decorate the same room using three different percentages of colors.
Curated OER
One Size Fits All, Part 1
Can you tell how tall someone is just by looking at their feet? In this activity, young mathematicians measure their height, arm span, and foot size, graph their findings, and answer questions about how these measurements are related....
Science Friday
Make a Model of a Home Made From Shipping Containers
Build a scale model of a home built out of shipping containers. A hands-on activity has scholars watch a video about a home built from shipping containers and then design their own home. They build scale models of their designed homes...
Curated OER
Multiplying Decimals and Mixed Numbers
Students practice multiplying decimals and/or mixed numbers, explore the effects of multiplying decimals and mixed numbers, and practice predicting the effects of multiplying a number by a decimal or mixed number.
Curated OER
Texas History Math
Seventh graders practice math skills while they become familiar with Texas' Boom & Bust economy and the natural history of the east Texas Piney Woods.
Curated OER
Aldridge Sawmill - The Story in Numbers
Seventh graders practice math skills while becoming familiar with Texas' "Boom & Bust" economy and the natural history of the east Texas Piney Woods. After researching the Aldridge Sawmill, 7th graders utilize a worksheet imbedded in...
Curated OER
Math Jeopardy: Basic Skills
Students play a PowerPoint activity to be used as a review of basic skills for order of operations, and the operations of addition, subtraction, multiplication, and division for whole numbers, some fractional numbers and integers....
Curated OER
Migrating Math
Young scholars practice estimating distance traveled while walking. Also can be used to introduce backpacking/hiking or as a daily warm-up. Measure the blacktop/cafeteria/playground, then determine how many times around make a mile.
Curated OER
Christmas Presents
Seventh graders create a graph of their Christmas gifts. They develop categories, compute fractional and decimal parts for each category, identify the number of degrees to represent each fractional part, and create a circle graph to...
Curated OER
Unexpected Answers
Students consider probability problems with unexpected and surprising answers.
Curated OER
Taste the Rainbow
Students practice estimating and graphing by utilizing Skittles. In this statistics lesson, students complete worksheets based on the likelihood of a certain color of skittle coming out of the bag. Students create a graph based on the...
Helping with Math
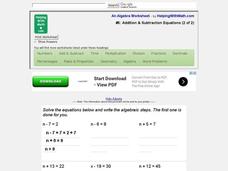
#6: Addition and Subtraction Equations (2 of 2)
This printable contains 12 basic equations to be solved. The first one is worked out as an example, and the answers for all can be found by clicking on a "Show Answers" box found on the website. The publisher has identified this as...
Other popular searches
- Estimate Fractions Products
- Estimate Fractions Rating=3
- Estimate Fractions Rating%
- Fractions Estimate
- Estimate Fractions Rating\%
- Estimate Fractions Rating\\%
- Estimate Fractions Rating\=3


