Curated OER
Gold Rush California and its Diverse Population
Young scholars compare contemporary cultural differences with historical differences based on population percentage. In this cross-curriculum Gold Rush/math lesson, students analyze aspects of California's Gold Rush population and...
Curated OER
How Many Penguins Does It Take? Studying Carrying Capacity and Limiting Factors
How does a population's habitat determine the size of that population? Teach learners about carrying capacity and limiting factors with an engaging roleplay activity. Class members pose as a colony of penguins who must gather food amidst...
Curated OER
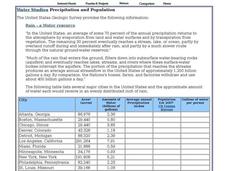
Water Studies: Precipitation and Population
For this water worksheet, students complete the chart about precipitation and population and answer short answer questions. Students complete 14 rows in the chart and answer 4 questions.
Curated OER
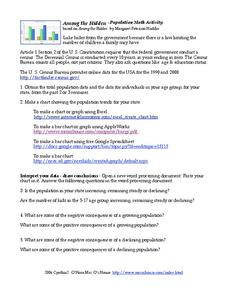
Among the Hidden - Population Math Activity
In this population worksheet, students collect data on population by researching the Census Bureau and then make online graphs and answer short answer questions about the data. Students complete 5 problems total.
Curated OER
In the Wake of Columbus
Students explore how the population decreased in native cultures.
Education World
Putting Turkey on a Table (or a Graph)
Grateful learners put turkey on a table (or a graph)! Through a creative project they show statistical information about turkey population, production, and consumption. A great Thanksgiving lesson that can be applied at any time to the...
Noyce Foundation
Ducklings
The class gets their mean and median all in a row with an assessment task that uses a population of ducklings to work with data displays and measures of central tendency. Pupils create a frequency chart and calculate the mean and median....
Curated OER
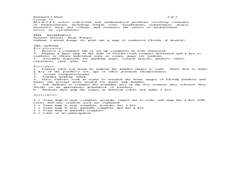
Home on the Range
Students use maps and mathematics to determine the appropriate panther population in a given area. In this Florida ecology lesson, students research the area requirements of male and female panther and use a map to help calculate how...
Curated OER
Mr. Cobbler's Shoe Dilemma
Students employ statistics to solve real-world problems. They collect, organize and describe data. They make inferences based on data analysis. They construct, read, and interpret tables, charts and graphs.
Curated OER
Follow a Bill!
Pupils participate in an activity to discover how a bill becomes law in California. In groups, they create a school program based on their own ideas for change. They develop and conduct a survey within their community and present their...
Redefining Progress
Have and Have-Not
Is there a correlation between a country's wealth and the extent of its ecological footprint? What exactly constitutes an ecological footprint, and how does one country stack up against the rest? This is a unique lesson to incorporate...
Curated OER
Have and Have-Not
Learners describe the differences of people living in developed and underdeveloped countries. They also identify how each type of country uses their resources. They develop an ecological footprint of the countries discussed.


