Hi, what do you want to do?
Curated OER
How Do You Spend Your Time?
Students keep records and determine how much time they spend on certain activities. They insert the data into a spreadsheet. Students graphically display data in a bar graph and a circle graph.
Curated OER
Collecting Data
In this data collection worksheet, learners read about how data is collected and organized. They also learn about a hypothesis. Students read through examples of different charts and then answer 23 questions pertaining to data...
Curated OER
Local Traffic Survey
Students conduct a traffic survey and interpret their data and use graphs and charts to display their results.
Curated OER
Understanding Symbols
In this symbols learning exercise, students read about how different symbols are used to represent variables or constants in equations. Then students complete 3 problems.
Curated OER
Aruba Cloud Cover Measured by Satellite
Learners analyze cloud cover and to compose written conclusions to a given related scenario. They submit a letter of response and a report detailing their calculations and conclusions.
Curated OER
Childhood Obesity
Learners identify a question to generate appropriate data and predict results. They distinguish between a total population and a sample and use a variety of methods to collect and record data. Students create classifications and ranges...
Curated OER
A Statistical Look at Jewish History
Students complete their examination over the Jewish Diaspora. Using population figures, they discover the importance of percentages in exploring trends. They use their own ethnic group and determine how it is represented in the United...
Curated OER
Data Shuffle
Pupils find an advertisement or newspaper using charts or graphs. They create another graph using the same information in a different format. They write a comparison of the two graphs.
Curated OER
Creating Bar Graph
Seventh graders, after an explanation and demonstration compare how many different places there at Cocowalk.
Curated OER
Seaside Science
Students research sea life using laptop computers. In this sea life lesson, students participate in a field trip to the beach and enter observations into their laptop computers. Students classify shells and sea life.
Curated OER
For The Birds
Seventh graders list the features of an ecosystem and identify local bird species. In this bird lesson students work in groups to formulate a hypothesis and test their theory by collecting and analyzing data.
Curated OER
Comparison of Snow Cover on Different Continents
Students use the Live Access Server (LAS) to form maps and a numerical text file of snow cover for each continent on a particular date. They analyze the data for each map and corresponding text file to determine an estimate of snow cover...
Khan Academy
Khan Academy: Creating Frequency Tables
Practice creating frequency tables from small data sets. Students receive immediate feedback and have the opportunity to try questions repeatedly, watch a video or receive hints.
Khan Academy
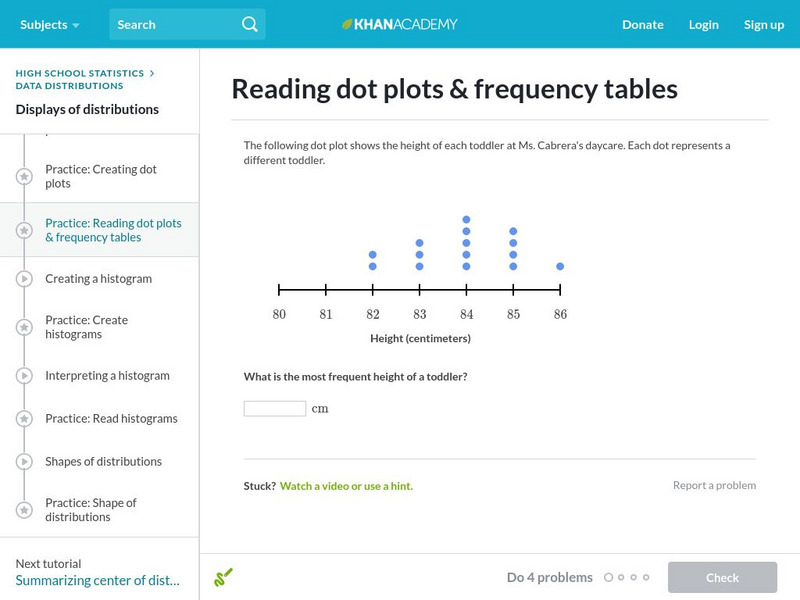
Khan Academy: Reading Dot Plots & Frequency Tables
Practice reading basic dot plots and frequency tables. Students receive immediate feedback and have the opportunity to try questions repeatedly, watch a video or receive hints.
Khan Academy
Khan Academy: Reading Dot Plots and Frequency Tables
In this exercise, students practice reading dot plots and frequency tables. Students receive immediate feedback and have the opportunity to get hints and try questions repeatedly.
Khan Academy
Khan Academy: Two Way Relative Frequency Tables
Practice creating two-way relative frequency tables from a two-way frequency table. Students receive immediate feedback and have the opportunity to try questions repeatedly, watch a video, or receive hints.
Khan Academy
Khan Academy: Creating Frequency Tables
In this exercise, students practice creating frequency tables. Students receive immediate feedback and have the opportunity to get hints and try questions repeatedly.
Khan Academy
Khan Academy: Two Way Frequency Tables
Given a Venn diagram or information about a relationship, create a two-way frequency table. Students receive immediate feedback and have the opportunity to try questions repeatedly, watch a video, or receive hints.
Khan Academy
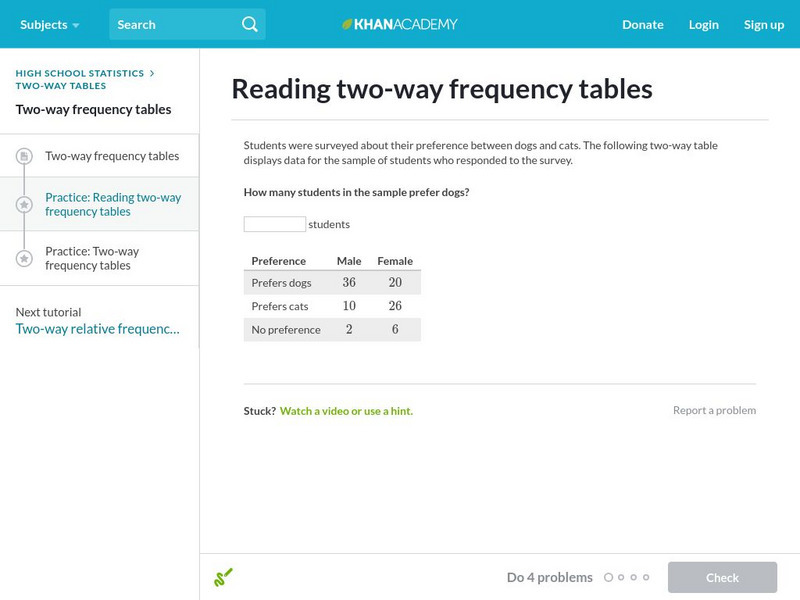
Khan Academy: Reading Two Way Frequency Tables
Practice interpreting two-way frequency tables. For example, what does the cell in the top left tell you? Students receive immediate feedback and have the opportunity to try questions repeatedly, watch a video, or receive hints.
Khan Academy
Khan Academy: Reading Two Way Relative Frequency Tables
Practice interpreting two-way relative frequency tables Students receive immediate feedback and have the opportunity to try questions repeatedly, watch a video or receive hints.
Khan Academy
Khan Academy: Calculating the Median: Data Displays
Practice computing the median of data sets presented in a variety of formats, such as frequency tables and dot plots. Students receive immediate feedback and have the opportunity to try questions repeatedly, watch a video or receive hints.
BBC
Bbc: Bitesize Revision: Data Handling: Mean
Need the basics on how to find a mean? Interactive examples are available that help you find the mean using data from a frequency table. You can also enter your own data and find the mean. You will find plenty of guided practice and...
Khan Academy
Khan Academy: Interpreting Two Way Tables
Do you understand how two-way tables really work? Here's your chance to practice. Students receive immediate feedback and have the opportunity to try questions repeatedly, watch a video, or receive hints.
Quia
Ixl Learning: Histograms
Brush up on your math skills relating to histograms then try some practice problems to test your understanding.


