Curated OER
Graphs and Data
Students investigate poverty using graphs. In this algebra lesson, students collect data on the effects of poverty and use different rules to analyze the data. They graph and use the trapezoid rule to interpret the data.
Curated OER
World Population Study
Students explore an exponential relationship and how it relates to human population growth and the current global population crisis. They graph both exponential and linear information.
Curated OER
WORLD POPULATION STUDY
Students explore an exponential relationship and how it relates to human population growth and the current global population crisis.
Curated OER
Skeeter Populations and Exponential Growth
Students perform investigations on the growth of populations and use exponential functions to represent that growth. They watch a video clip of growth patterns. Students work in groups to determine the "population" of each color of...
Curated OER
The Coyote Population: Kansas Prairies
Students discover animal lifestyles by researching their ecosystem. In this animal statistics lesson, students research the geography of Kansas and discuss the reasons why wild animals survive in the open Kansas fields. Students complete...
Curated OER
Bald Eagle Population Graphing
Pupils create graphs to illustrate the bald eagle population. They identify the population of bald eagles in Minnesota and the United States. They create three graphs to represent the population data including a line, bar, and...
EngageNY
Random Sampling
Sample pennies to gain an understanding of their ages. The 16th installment of a 25-part series requires groups to collect samples from a jar of pennies. Pupils compare the distribution of their samples with the distribution of the...
US Department of Commerce
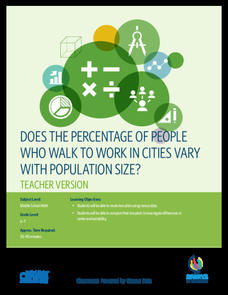
Does the Percentage of People Who Walk to Work in Cities Vary with Population Size?
To walk or not to walk? Pupils create box plots comparing the percentage of residents who walk to work in large, medium, and small cities. Using the box plots, class members compare the data that reflects available statistics. Scholars...
Curated OER
The World is a Village
Students observe Americans through the eyes of the world. In this human population lesson plan, students utilize the Internet to view the World Pop Clock and follow the world's population by the minute. Students predict what the...
Curated OER
Analyzing the Job Market for Babysitting in Your Neighborhood
Students conduct research on a neighborhood in Canada. In this data analysis lesson plan, students use data from the 2006 Canadian census to draw conclusions about a population group.
Curated OER
School Population
In this math worksheet, students solve the problem of creating ratios for the school population. There is an example on page 1.
Curated OER
Thinking About the Environment: Where Are Our Forests?
Learners investigate our lack of forests by examining population. In this deforestation lesson, students research a list of the continents, their populations, and remaining forest area. Learners discuss why forests are disappearing and...
Curated OER
US Airports, Assessment Variation
Determining relationships is all part of algebra and functions. Your mathematicians will decide the type of relationship between airports and population and translate what the slope and y-intercept represent. The problem is multiple...
Noyce Foundation
Ducklings
The class gets their mean and median all in a row with an assessment task that uses a population of ducklings to work with data displays and measures of central tendency. Pupils create a frequency chart and calculate the mean and median....
PBS
The History and Use of Sampling Methods
Young mathematicians define population, draw convenience sample from the population, draw quota sample from the population, and draw random probability sample from the population. They explain why a random probability sample usually...
Education World
Putting Turkey on a Table (or a Graph)
Grateful learners put turkey on a table (or a graph)! Through a creative project they show statistical information about turkey population, production, and consumption. A great Thanksgiving lesson that can be applied at any time to the...
College at Brockport
Healthy Ecosystems
Is there a connection between the snowshoe hare population and the lynx population? Young scientists will examine this question and graph actual data to determine the relationship between these two species, as well as researching another...
Curated OER
Border Math
Students examine and interpret data relating to U.S.-Mexico borderland realities, and consider such aspects of social science as the study of population, crime, government spending, pollution, health, and economics.
Curated OER
Assessing the quality of habitat for Monarch Butterflies
Students use different sampling methods to determine the population size and appropriate space for monarch butterflies. In this averages lesson plan, students complete word problems where they can accurately estimate the size of an...
Curated OER
Estimating Fish Populations
Students describe the mark/recapture method used to estimate fish populations. They explain the importance of being able to predict population numbers.
Curated OER
Studies of the Eastern Worlds: Population Graphing
Seventh graders participate in several learning/research stations in which they view artwork from various countries of the Eastern world and collect information on the populations of the Eastern countries. They then use this information...
National Council of Teachers of Mathematics
Rough Rule
For this algebra activity, learners estimate the Canadian population using the rough rule. There are two questions.
Illustrative Mathematics
Mr. Brigg's Class Likes Math
A quick discussion question that brings some collaboration into your classroom will allow your thinkers to make a decision about sampling. Mr. Briggs wants to know if the results from his class are a valuable comparison to the entire...
Curated OER
What's in a Graph?
How many yellow Skittles® come in a fun-size package? Use candy color data to construct a bar graph and a pie chart. Pupils analyze bar graphs of real-life data on the Texas and Massachusetts populations. As an assessment at the end of...
Other popular searches
- Populations and Ecosystems
- Animal Populations
- Populations, Ecology
- Fish Populations
- Populations and Communities
- Deer Populations
- Bird Populations
- Limits on Populations
- Aboriginal Populations
- Human Populations
- Marine Mammals Populations
- Indigenous Populations


