Curated OER
Energy Conservation (Middle, Mathematics)
Students take turns reading the electric meter six times a day at regularly scheduled intervals. They figure out the amount of electricity used and then determine the total cost of electricity for the week.
Curated OER
Chart/Graph
Students create a class survey, place the data in a spreadsheet and graph the information.
Curated OER
Make a Dinosaur
Students estimate the size of dinosaurs and create a dinosaur model. They create bar graphs of the sizes of dinosaurs one in meters and the other in "student" units. They draw a pictures and add words or sentences about their dinosaur.
Curated OER
Data Analysis, Probability, and Discrete Math: Lesson 5
Eighth graders are read the material that is printed in boldface type inside the boxes. Information in regular type inside the boxes and all information outside the boxes should not be read to them. They then find the mean, median,...
Curated OER
Math: A Geometric Neighborhood
Students, as a final project, draw a picture of their ideal neighborhood on a sunny day. In addition to the sun, their drawings include homes, trees, streets, and selected objects. Each object in their drawing has a written description...
Curated OER
Math:Survey Role-Playing Activity
Learners create survey questions to discover why students join clubs. Using sampling methods and question phrasing techniques, they conduct the survey both in and out of school. Once learners analyze their survey information, they...
Curated OER
Brian's Pegboard II
Learners are able to assess a problem and use systematic methods to solve the problem. They also find out all the possible outcomes for a sequence of events using tree diagrams.
Curated OER
Vampires: Fact or Fiction?
Students predict how many vampires are in the world, based on the legend that, once bitten, each victim becomes a vampire. Extrapolating how many vampires would populate the earth in 30+ weeks, students then compare the total predicted...
Curated OER
Flavorful Spreadsheets
Students create a spreadsheet which includes a bar graph. They sort and classify information and use the average function on a spreadsheet. They research Skittles candy and summarize their findings on a spreadsheet.
Curated OER
Modular Arithmetic on the Planet of the Eights
Students explore modular arithmetic involving base eight. They participate in an activity where society functions around the numbers one through eight. Students explain how life will operate with only these numbers.
Curated OER
Gorilla Alphabet and Number Cards
For this gorilla alphabet and number cards worksheet, students color and cut apart a separate card for each upper and lower case (Zaner-Bloser) alphabet letter. Students also color the number cards from 1 to 10.
Curated OER
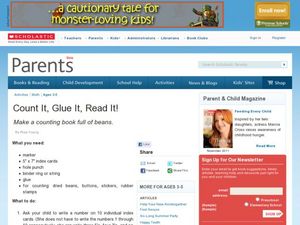
Count it, Glue it, Read it!
Students identify numbers 1-10 and count objects to match corresponding numbers. In the number sense lesson, students create a counting book, matching numbers they've written on index cards with the correct number of items (beans,...
Curated OER
Using Current Data for Graphing Skills
Students graph demographic information. In this graphing lesson, students choose what type of graph to create and what information to display. Links to examples of graphs and statistical data are provided. The graphs are created on the...
Curated OER
Locating Places - Making a Map Grid
Pupils learn how to use a letter and number map grid. In this map grid lesson, students look at a landscape map and describe how to locate the airport. They compare the descriptions of different pupils to determine how they are the same...
Curated OER
Downloading and Installing Apps
Learners investigate the TI-73 calculator. In this middle school mathematics lesson, students examine the procedures for downloading and installing applications to the computer for the TI-73 Explorer.
Curated OER
Probability
Eighth graders relate real life events with probability. In this probability lesson, 8th graders investigate using coin toss, discuss NBA shooting percentages and MLB batting averages. Students also complete a worksheet.
Other popular searches
- Wants and Needs
- Basic Needs and Wants
- Needs and Wants Worksheets
- Wants and Needs Activity
- Economic Wants and Needs
- Wants and Needs Lessons
- Wants Needs
- Economics Needs and Wants
- Kindergarten Needs Wants
- Consumer Wants and Needs
- Wants vs Needs
- Peoples Needs and Wants


