Curated OER
Graphing Linear Equations
In this linear equations instructional activity, students graph 2 linear equations using x- and y- intercepts. Students then graph 2 additional equations using the slope and y-intercept method.
Curated OER
Graphing 3 Ways
In this graphing activity, students graph 10 equations using the following methods: slope-intercept form, x- and y-intercepts, or by using a table. Students check their work using a graphing calculator.
Curated OER
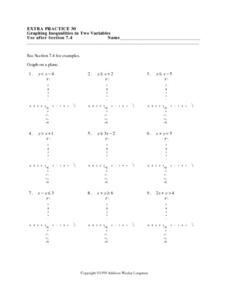
Graphing Inequalities in Two Variables
In this graphing inequalities worksheet, students shade 3 inequality problems. Students then graph and shade 4 additional inequalities.
Curated OER
Graphing Inequalities
In this graphing inequalities learning exercise, students complete 8 inequality tables. Students then graph and shade the 8 inequalities on a coordinate plane.
Curated OER
Sources of Generational Music
In this Louisiana music history learning exercise, students select two online readings from the "Louisiana Living Traditions" website to read. Upon completion of the readings, students explore what they learned in the articles and from...
Curated OER
Line Graphs
In this line graphs activity, 8th graders solve and complete 10 different problems that include various line graphs. First, they use each line graph shown to respond to the questions that follow regarding books and population. Then,...
Curated OER
Ocean Waves and Tides
In this tides learning exercise, students will use a tide chart to plot 15 data points onto a graph. Students will be looking at high tides and low tides and comparing the ranges. This learning exercise has 2 short answer questions.
Curated OER
Reading and Making Pie Graphs
In this pie graphs worksheet, students solve 10 different problems that include reading a pie graph. First, they use the pie graph to respond to 5 questions that follow. Students determine the year that had the smallest and largest...
Curated OER
Area on a Coordinate Grid
In this area on a coordinate grid worksheet, students solve and graph 10 different problems on a coordinate grid. First, they determine the area of the given figures in each. Then, students determine the length of each side of the...
Curated OER
Writing Coordinates
In this writing coordinates worksheet, learners solve and graph 6 different problems related to writing various coordinates on the graph. First, they move to the right and up on the grid, naming the point found. Then, students move up or...
Curated OER
Locate Ordered Pairs
In this ordered pairs worksheet, students solve and graph 6 different graphs that include various ordered pairs. They determine each ordered pair shown in the graphs. Then, students write the letter for the point named by the ordered...
Curated OER
Freezing and Boiling Point
In this freezing and boiling point graph activity, students use the graph illustrated to respond to several questions that follow. They identify what is the freezing, boiling, and melting point of the substance in the graph. Students...
Curated OER
Experiment Data Recording Sheet
In this science worksheet, students record data collected during a ten day experiment. They record the date and data collected for each of the ten days in a table on the sheet. They record the date since the data does not have to be...
Curated OER
Graphing Inequalities in Two Variables: Extra Practice 30
In this math worksheet, students graph inequalities on a coordinate grid. The eight problems have a coefficient of one for the y variable. Three problems have a negative value for y. The final four problems are horizontal or vertical lines.
Curated OER
Megabeasts
In this biology worksheet, students use their mathematical skills to create a three dimensional scale model of an ancient insect. They draw a diagram of their insect and label it with as much information as possible.
Curated OER
Make A Plan
In this science worksheet, students create a plan on what product they will test. They describe what they want to discover about this product and write questions that address the goal of their experiment. Finally, students determine what...
Curated OER
Amazing Ads
In this science project worksheet, students name the product and company associated with each famous ad slogan listed. Then they survey the media to locate examples of each technique described in the boxes. Students also create a new...
Curated OER
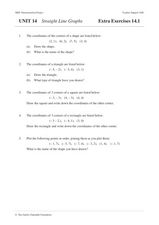
Straight Line Graphs
In this math instructional activity, students plot lines on a graph paper when given the equation for the line in slope-intercept form. They tell the values of the slope and the y-intercept. Students find the x and y intercepts and plot...
Curated OER
Novel Response "The Night of The Twisters"
In this language arts worksheet, students graph interest in each chapter that is read in the book Night of The Twisters. They use the graph to analyze class opinion of the book.
Curated OER
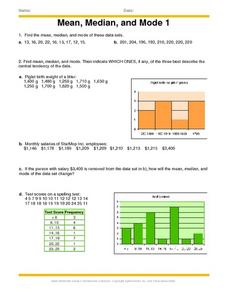
Mean, Median And Mode 1
In this mean, median and mode worksheet, learners problem solve and calculate the answers to ten word problems associated with the mean, median and mode of collected data.
Curated OER
Graph Paper
In this literacy worksheet, students are asked to complete the graphing activities using the newly created worksheets. The sheet itself is a guide for teachers to create graph paper styles.
Curated OER
Asymmetric Graph Paper
In this literacy worksheet, students use the created asymmetrical graph paper for class activities. The sheet is intended to be a teacher's guide.
Curated OER
Axis Graph Paper
In this literacy worksheet, students use the axis graph paper that is created using this worksheet. The sheet is a teacher's guide.
Curated OER
Pie Chart
For this literacy worksheet, students use the created resources for further progress towards knowledge. The sheet is a teacher's guide for creating student resources.


