Curated OER
Data Representation
Students solve real life scenarios using math. For this geometry lesson, students collect, predict and interpret data. They measure a chair using different measurements and choose what would make the chair the best design.
Curated OER
Length and Speed of a Robot
Pupils calculate the speed and length of parts of the robot. In this algebra lesson, students measure the length of robots legs. They calculate the time it takes the robot to travel a specific distance.
Curated OER
Robot Ramps
Learners write the slope of a linear equation. In this algebra lesson plan, students follow a robot along a coordinate plane and create an equation to represent the ramp created. They identify the points the ramp passes through.
Curated OER
Constructing and Solving Linear Equations
Learners solve linear equations In this algebra instructional activity, students create linear equations using integer coefficients greater than one. They graph their solution on a coordinate plane.
Curated OER
Creating a Spreadsheet
Students create a spreadsheet using ICT. In this algebra lesson, students collect and graph their data using a spreadsheet. They find solution to a given problem using trial and error.
Curated OER
Using a Multi- Sensory Approach
Learners identify the slope of a line given two points on the line. In this algebra lesson, students solve linear equations by finding and comparing slopes of lines. They differentiate between the steepness of the slope and the line.
Curated OER
How Do They Relate? Linear Relationship
Students collect information and use a line to represent it. In this algebra lesson, students investigate real world data to see if it makes a line. They graph the line comparing the relationship of the x axis with that of the y axis.
Curated OER
Line of Best Fit
Students identify the line of best fit. In this statistics lesson, students collect and analyze data. They calculate the regression equations and identify the different types of correlation.
Curated OER
The Swinging Pendulum
Students observe a pendulum and graph their observation. In this algebra lesson, students use the TI calcualtor to graph the motion the pendulum makes. They analyze the graph and make predictions.
Curated OER
Slopey Math
Students identify the slope of a line and use it to solve real life problems. In this algebra lesson, students write linear equations in slope intercept form and make a correlation to its relation to the real world. They use the slope an...
Curated OER
La Toteca- A Tropical Paradise
Students collect data on the time of the ferry. For this algebra lesson, students use the data to predict a ferry schedule. They also compute the depth where oxygen would be needed when diving.
Curated OER
Conductivity of salt Solutions
Students investigate the concentration level of solutions. In this math/science lesson, students identify three different ionic compounds. They predict the conductivity of each using their collected data.
Curated OER
Walking on Air
Students collect and analyze data with a graph. In this statistics lesson, students use central tendencies to find the meaning of their data. They display the data on a Ti calculator.
Curated OER
Beginning Modeling for Linear and Quadratic Data
Pupils create models to represent both linear and quadratic equations. In this algebra lesson, students collect data from the real world and analyze it. They graph and differentiate between the two types.
Curated OER
Fractal Fern
Students identify the location of coordinate pairs of an image. In this geometry lesson, students perform transformation and identify the image and pre-image point of location. They apply the concept of fractals to complete the...
Curated OER
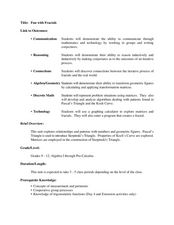
Fun With Fractals
Students use fractals to analyze nature. In this geometry lesson, students work in groups using technology and math to communicate. They identify where in the real world fractal can be seen.
Curated OER
Impact!!
Young scholars perform a science experiment. In this algebra lesson, students collect data from their experiment and create a graph. They analyze the graph and draw conclusion.
Curated OER
Cruising the Internet
Students identify the parts of an engine using a graph. In this statistics lesson, students make a graph from their collected data. They calculate the volume of a cylinder using a line of regression and a scatter plot.
Curated OER
Fencing Your Backyard
Young scholars use geosketch ro create a fence. In this geometry lesson, students identify the amount of material and area needed to create a fence. They calculate the perimeter and surface area of their fence.
Curated OER
Houses and Cars and Loans
Young scholars create a spreadsheet to track their spending. In this algebra lesson, students use loan formulas to calculate the payback amount plus interest on a loan. They calculate how much money they would need to buy a car and house.
Curated OER
United States Population: Using Quadratic Models
In this United States population worksheet, students solve word problems about the United States population by using the quadratic formula. Students complete 6 problems.
Curated OER
Finding Patterns in Tiles
Learners explore perimeter and area of rectangles. In this rectangular lesson, students use tiles to discover the formulas for perimeter and area. Learners solve for area.
Curated OER
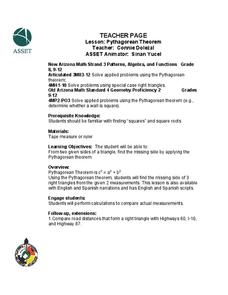
Pythagorean Theorem
Students apply properties of Pythagorean to solve problems. In this geometry lesson, students identify the different parts of a right triangle using ratios. they solve problems using squares and square roots.
Curated OER
Building a Rover
Middle schoolers investigate properties of lines and points by making a rover. In this algebra lesson, students plot points correctly on a coordinate plane. They identify coordinate pairs given the plots and lines.
Other popular searches
- Math Functions
- Quadratic Functions
- Exponential Functions
- Linear Functions
- Rational Functions
- Parent Functions
- Trigonometric Functions
- Inverse Functions
- Eye Functions
- Composite Functions
- Cell Organelles Functions
- Trigonometry Functions


