Texas Instruments
Is It or Isn't It Proportional
How can you tell if number relationships are proportional? Mathematicians investigate proportional relationships. They compare and contrast functions and graphs to determine the characteristics of proportional relationships, as well as...
Concord Consortium
Betweenness II
Read between the curves ... quadratic curves! Young scholars analyze the graphs of two quadratic functions by writing their own function whose outputs are between the two given. They then consider intersecting quadratic functions and...
Concord Consortium
Intersections I
One, two, or zero solutions—quadratic systems have a variety of solution possibilities. Using the parent function and the standard form of the function, learners describe the values of a, b, and c that produce each solution type. They...
EngageNY
Relationships Between Quantities and Reasoning with Equations and Their Graphs
Graphing all kinds of situations in one and two variables is the focus of this detailed unit of daily lessons, teaching notes, and assessments. Learners start with piece-wise functions and work their way through setting up and solving...
CK-12 Foundation
Function Rules for Input-Output Tables: Function Machine 2
Model function operations using a function machine. An interactive lesson has learners determine the patterns of a double function machine. They use the patterns to write functions and make connections between the inputs and outputs.
Curated OER
Functions and the Vertical Line Test
Learners examine functions and function notation. They use computer activities to discover how to graph functions, and conduct a vertical line test. Students describe spatial relationships using coordinate geometry.
Curated OER
Introduction to Functions
Students explore functions, function rules, and data tables. They explore terms of linear functions. Students use computers to analyze the functions. Students write short sentences to explain data tables and simple algebraic expressions.
Curated OER
Up, Down, Right, Left - Function Families
Students explore quadratic functions. In this function family worksheet, students examine the quadratic function and the family of functions. They identify the affects of the shape of the parabola and its position on the coordinate...
Curated OER
Functions & Algebra
Students examine linear equations. For this functions and algebra lesson, students write equations in the slope-intercept form. They enter data in a graphing calculator, examine tables, and write linear equations to match the data.
Curated OER
Patterns, Functions, and Algebra: Wired for Space
Students assess how patterns, functions and algebra can assist NASA engineers design new ways of propelling spacecrafts. They explore how electricity and magnetism are replacing the fuel-consuming rocket propulsion. Electromagnetism is...
Curated OER
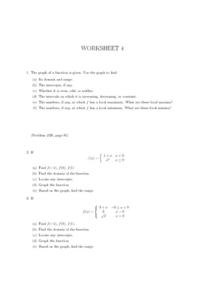
Worksheet 4, Functions
Eighth and ninth graders graph a given function and identify the domain, range and intercepts. Theytell the intervals that the function is increasing, decreasing, or constant. Pupils identify the minimum and maximum of the graph, and...
Curated OER
Using Data Analysis to Review Linear Functions
Using either data provided or data that has been collected, young mathematicians graph linear functions to best fit their scatterplot. They also analyze their data and make predicitons based on the data. This lesson plan is intended as a...
Curated OER
Graphing Linear Functions
In this linear functions learning exercise, students graph 3 linear functions. Students graph each function by making a table of values given a linear function in standard form.
Curated OER
Graphing Linear Functions Two
Use this graphing linear functions worksheet to have learners graph three linear equations. They use a table of values, the intercept method, and slope-intercept form to graph three functions.
Concord Consortium
Sum and Product
From linear to quadratic with a simple operation. An exploratory lesson challenges learners to find two linear functions that, when multiplied, produce a given parabola. The task includes the graph of the sum of the functions as well as...
Curated OER
The M & M Function
In this M & M learning exercise, learners perform probability experiments. They collect and interpret data, identify the exponential function describing the data and create graphs from the collected information. This one-page...
Curated OER
Finding the Inverse from a List or Function
For this algebra worksheet, students reverse the numbers of a list to determine the inverse or start with a function to find the inverse. There are 4 questions.
Teach Engineering
Can You Resist This?
Some things are hard to resist. Small collaborative groups build circuits and calculate the voltage using Ohm's Law. Budding engineers explore the connection between the voltage across different resistors and linear functions with...
Illustrative Mathematics
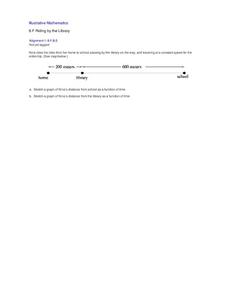
Riding by the Library
Draw a graph that shows the qualitative features of a function that has been described verbally. Make sure learners understand where time is zero and the distance is zero. It may take them some time to understand this concept, so working...
Illustrative Mathematics
Tides
A very simple example of a functional relationship between depth of water and time is shown here. In fact, it might be more useful to use a coastal tide book to better illustrate this real-world experience. Pupils are to count the number...
Illustrative Mathematics
Distance across the channel
Here you will find a model of a linear relationship between two quantities, the water depth of a channel and the distance across the channel at water level. The cross section of the channel is the shape of an isosceles trapezoid. The...
Illustrative Mathematics
Velocity vs. Distance
At the end of this activity, your number crunchers will have a better understanding as to how to describe graphs of velocity versus time and distance versus time. It is easy for learners to misinterpret graphs of velocity, so have them...
Curated OER
Substitution "Plugging In"
The old plug and chug method will help the class investigate functional notation. They explore the meaning of functional notation, f(x), and determine the functional value of given values. The instructional activity includes two...
Curated OER
Fast Talker - Ch 2 project
Tongue Twisters?! Create scatter plot graphs based on timing fellow classmates saying tongue twisters. Then investigate, display, and analyze the relationships based on functions. Wrap up this activity by making a poster or other...
Other popular searches
- Math Functions
- Quadratic Functions
- Exponential Functions
- Linear Functions
- Rational Functions
- Parent Functions
- Trigonometric Functions
- Inverse Functions
- Eye Functions
- Composite Functions
- Cell Organelles Functions
- Trigonometry Functions


