Curated OER
Graphing Absolute Value Equations
In this algebra worksheet, students graph absolute value equations and use translations to move the graph around on a coordinate plane. There are 4 questions with an answer key.
Curated OER
Viewing Tubes
Middle schoolers complete a lab in order to discover if the length of a viewing tube, its diameter, or the distance from an object affect the type of data collected and the resulting graph.
Curated OER
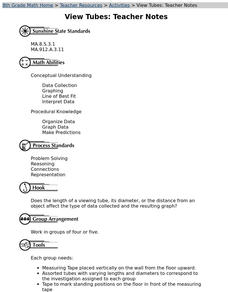
View Tubes
Eighth graders decide if the length of a viewing tube, its diameter, or the distance from an object affects the type of data collected and the resulting graph through a series of experiments.
Curated OER
Model and Solve Algebraic Equations
Examine multiple ways to solve algebraic equations. Pupils will generate a problem solving strategy that addresses the prompt given by the teacher. They will then share their problem solving strategy with the class. Graphic organizers,...
Curated OER
Bubble Gum Chemistry
Students explore the concept of graphing data. In this graphing data lesson, students determine the percentage of sugar in bubble gum. Students graph type of gum vs. sugar percentage. Students create a table of their data.
Curated OER
What Are The Chances
Students calculate the probability of an event occurring. In this probability instructional activity, students differentiate between independent, dependent or compound events. They find the range of the data.
Curated OER
Exploring Arrangements of 2, 3, 4, and 5 Cubes
Students use problem solving skills to create various models of tricubes, tetracubes, and pentacubes. They classify the cubes into various groupings and identify them as mirror images, regular arrangements, and irregular arrangements....
Curated OER
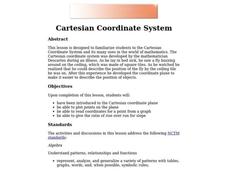
Cartesian Coordinate System
Students explore the Cartesian coordinate plane and plot points on the graph. They interpret coordinates for a point from the graph and give the ratio of rise over run for slope.
Curated OER
Hot Wheels
Students observe the action produced by toy cars. In this geometry lesson, students discuss motion and distance as they relate to the movement of a spherical object.They collect data and make conjectures based on their data.
Curated OER
Graphing and the Coordinate Plane
Students gain practice reading coordinates and plotting points by participating in the Coordinates! Game. They demonstrate and test their skills with graph paper and the Maze Game.
Curated OER
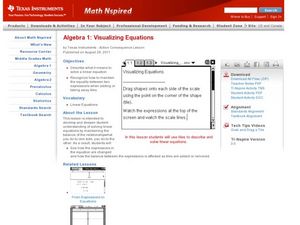
Visualiziing Equations
Students use visuals and words to solve equations. In this algebra lesson, students observe the necessary steps needed to add, subtract,multiply and divide to solve an equation. They graph their solution using the TI calculator.
Curated OER
Walking on Air
Students collect and analyze data with a graph. In this statistics lesson, students use central tendencies to find the meaning of their data. They display the data on a Ti calculator.
Curated OER
Comparison of Two Different Gender Sports Teams - Part 1 of 3 Measures of Central Tendency
Students gather and analyze data from sports teams. In this measures of central tendency lesson, students gather information from websites about sports team performance. Students analyze and draw conclusions from this data. This lesson...
Curated OER
Inverse Variation
In this algebra learning exercise, learners find the inverse of an equations. They graph their solutions and analyze it. There are 8 questions.
Curated OER
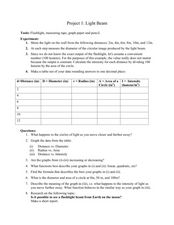
Light Beam
Students measure and convert between units. For this geometry lesson, students investigate through measurements of distances. They relate the properties of circle to solving problems with radius, diameter and area.
Curated OER
Equations and Systems of Equations
Students practice using algebra to be applied to real world situational problems. The key concepts of translation of language to algebraic expressions is covered. They also look in depth at relationships between different quantities.
Curated OER
Finding Patterns in Fractals
Students discover patterns and sequences. They use a website to explore patterns and fractals. Students share their discovery of fractals and their patterns with the class. They develop a list of patterns used in everyday life.
Curated OER
Pascal's Triangle
Students study Pascal's triangle. They construct their own version of Pascal's triangle, and relate some of the uses for it. While working through this process, students practice their integer multiplication and division skills.
Curated OER
Worksheet 19
In this math activity, students use the following descriptions of a spring system to write a differential equation of the form my + γy + ky = F(x).
Curated OER
Recognizing Patterns
Middle schoolers explore the concept of patterns. In this patterns lesson, students use applets to manipulate tessellations. Middle schoolers predict the next number in a sequence by recognizing patterns.
Curated OER
What are the Odds
Students predict the-outcome of an event. In this algebra lesson, students compare and contrast the probability of an event occurring. They calculate the odds of a simple event and make estimation.
Curated OER
The Swinging Pendulum
Students observe a pendulum and graph their observation. In this algebra lesson, students use the TI calcualtor to graph the motion the pendulum makes. They analyze the graph and make predictions.
Curated OER
La Toteca- A Tropical Paradise
Students collect data on the time of the ferry. For this algebra lesson, students use the data to predict a ferry schedule. They also compute the depth where oxygen would be needed when diving.
Curated OER
Exploring Arrangements of 2, 3, 4, and 5 Cubes
Students construct models of various tricubes, tetracubes, and pentacubes that are possible, classify n-cubes into different groupings, and draw these figures on isometric dot paper giving true perspective to what they visualize.
Other popular searches
- Graphing Linear Functions
- Linear Functions and Graphs
- Writing Linear Functions
- Nonlinear Functions
- Inverse Linear Functions
- Graphs of Linear Functions
- Nonlinear Equations
- Linear Functions Activity
- Linear Functions Math Models
- Linear Functions to Graph
- Linear Functions and Models
- Power Point Linear Functions


